Research cockpit · PGHH valuation 2026
₹1,730–₹9,003 per share
Full four-scenario valuation range · Model dated 11 October 2026
A recovery is possible; its value depends on the price paid. The ₹6,942.50 reference price sits above our recovery case and below the optimistic stretch. The ₹3,441 base contains conservative judgments. These four cases are not a forecast interval or equally likely outcomes.
| Research cockpit | Basis |
|---|---|
| Company / sector | PGHH · NSE · Consumer health and hygiene |
| Reference price | ₹6,942.50 · official NSE close, 9 October 2026 [S11] |
| Model / evidence | 11 October 2026 valuation · financials through June 2026 |
| Horizon / update | 3–5 year research horizon · ten-year DCF · published 13 October 2026 |
| Author / charge | Aditya Siddharth Mehta · Company Anatomy · Free |
| Declared interests | No PGHH holdings, compensation or other conflicts declared; associate/relative scope is knowledge-qualified. See dated disclosures. |
Read the ranges correctly: the middle 90% of 5,000 conditional model values is ₹2,815–₹4,363, distinct from the four-scenario range above. Neither is a probability interval for the future share price. A 25% cushion below the lower of the base and simulated median implies about ₹2,571; this is a model-based review threshold, not an automatic order or a guaranteed floor.
The business and investment question
How the company makes money, what changed, and what investors should watch
Most people know Whisper and Vicks from the products they buy. Fewer know that these brands sit inside an Indian listed company whose share price has fallen sharply. The investment question is whether this reflects a temporary setback, slower long-term growth, or a price that previously expected too much.
This report starts with the business: who its customers are, why they buy its products, and how those purchases become profit. It then explains the recent results, the share-price fall and the assumptions behind our valuation.
| At a glance | What it means |
|---|---|
| Company | Procter & Gamble Hygiene and Health Care Ltd; NSE symbol PGHH |
| Main businesses | Whisper menstrual-care products and Vicks cough-and-cold products |
| Annual sales | ₹4,290 crore in the year ended March 2026 |
| Annual net profit | ₹857 crore; approximately ₹20 profit for each ₹100 of annual sales |
| Latest reported quarter in this study | June 2026: sales down 4.9%; net profit down 34.3% from June 2025 |
| Price reference for the model | ₹6,942.50, official NSE close on 9 October 2026 |
Read the valuation as a set of possibilities. The existing ₹3,441 central estimate contains conservative choices that are not all established facts. This edition explains those choices openly. It does not claim that a spreadsheet can identify one certain fair price.
Updated 12 October 2026. Financial evidence through June 2026; valuation model dated 11 October. A separate 12 October indicative price update appears in the share-performance section. [S1-S2, S11]
What exactly are you buying?
A stake in a focused Indian consumer-products company
Buying PGHH shares gives you a share of the profits and cash generated by this listed company. It does not give you ownership of every P&G product sold in India. Global P&G operates through several entities; P&G Health Ltd is also a different listed company.
| Business | Products customers know | How demand behaves |
|---|---|---|
| Feminine care / menstrual care | Whisper pads, night-use products and period-panty formats | Repeat purchases, broader product adoption, price per use and competition matter. |
| Healthcare | Vicks rubs, cough drops and other cough-and-cold formats | Usage is more linked to illness episodes, weather and seasonal demand. |
| Other products | The annual report also names Old Spice | A smaller part of the portfolio; its revenue is not separately disclosed here. |
![Company FY2026 BRSR: sanitary napkins 65% and healthcare 33% of turnover, both rounded. The remaining 2% is arithmetic residual, not a disclosed Old Spice revenue figure. [S1]](https://companyanatomy.com/wp-content/uploads/2026/10/PGHH_business_mix.png)
Think of a “vertical” as a main line of business. Whisper and Vicks have different customers’ needs and growth drivers, even though they share company capabilities. These descriptions do not imply that separate brand profits are publicly available.
How the company got here
From a healthcare business to today’s Whisper-and-Vicks franchise
| Period | Milestone | Why it matters |
|---|---|---|
| 1964 | Incorporated in India as Richardson Hindustan Ltd. | The Indian listed company has its own history; it did not begin with the launch of Whisper. |
| 1985 | P&G acquired the company, according to its annual report. | The business gained a global parent with brands, technology and operating capabilities. |
| 1989 | A 2023 brokerage history dates the Whisper launch to this year. | Feminine care became an additional business alongside the healthcare heritage. This date is from a secondary source. |
| By 1999 | Contemporary business coverage describes a deliberate focus on feminine hygiene and healthcare. | Today’s concentration on Whisper and Vicks reflects a long-running portfolio strategy. |
| 2025 | The financial year changed: the transition reporting period covered nine months. | Annual comparisons require adjustment; nine-month sales cannot be compared directly with twelve months. |
| 2026 | Full-year sales were broadly flat on a matched basis; the June quarter was weaker. | The present debate is about future growth and profit durability, not whether these are established brands. |
The first two dates are confirmed by the FY2026 annual report. Whisper’s launch date and the late-1990s strategy are supported by the separately identified historical sources. The report avoids choosing an exact legal name-change date where secondary histories differ. [S1, S33-S34]
The business lesson: a long history can build trust and distribution, but it does not remove the need to keep products relevant and competitively priced. Shareholders ultimately benefit from future cash generation, rather than the age of the brand.
Whisper: the larger growth engine
More users, more regular use and the right product at the right price
Whisper serves a recurring consumer need. Revenue can increase when more people adopt commercially sold menstrual products, existing users buy them more regularly, customers choose higher-priced formats, or Whisper gains business from competitors.
| Growth driver | Plain-English example | What can go wrong |
|---|---|---|
| Category adoption | A customer begins buying pads more regularly. | Affordability, access and preferences can limit adoption. |
| Product choice | A customer buys a night-use or period-panty format. | A new format may replace an existing Whisper purchase instead of adding a sale. |
| Market share | More of the category’s spending goes to Whisper. | Competitors may offer a more attractive price, product or shopping experience. |
| Distribution | Products are available in more relevant stores and online channels. | More availability does not guarantee repeat purchases; discounts may reduce company receipts. |
Simple example: if the category grows by 8% and Whisper keeps the same share, its comparable domestic sales should also grow by about 8%, assuming company receipts keep pace with retail spending. If its share rises or falls, sales grow faster or slower. Exports must be considered separately.
The available 47% figure is a 2025 share of broad menstrual-care retail sales by value. It is not a verified current pad-only share. The proposed 44% starting point remains unconfirmed. The model therefore tests share changes instead of treating an unverified fall as an established fact. [S23]
Watch whether the company wins repeat purchases at attractive economics. Product launches, advertising reach and category growth are useful signals, but none alone proves higher profit.
Vicks: familiar products, different demand
Healthcare provides a second earnings source, with more seasonal influences
Vicks is associated with everyday cough-and-cold products. The financial statements group products into classes such as ointments and creams, cough drops and tablets. These classes help us estimate the starting sales mix, but they do not reveal a separate profit margin for every brand or product.
| Product class | FY2026 sales | How the model treats it |
|---|---|---|
| Ointments and creams | ₹920 crore | A proxy for the rubs-led business; central growth assumption 4% a year initially. |
| Cough drops | ₹377 crore | Central growth assumption 7%; tests range from 2% to 12%. |
| Tablets | ₹96 crore | Central growth assumption 3%; tests range from -2% to 8%. |
Those product classes together represent about a third of company revenue. Growth can come from distribution, new formats, availability, consumer preference and prices. Demand also varies with the incidence and timing of seasonal illness; an unusually strong or weak quarter should not automatically become the long-term forecast. [S1, S7]
Why Vicks matters to a shareholder: it adds another source of earnings, but it does not make PGHH broadly diversified. A weaker healthcare season can coincide with pressure in feminine care. We therefore forecast the major product classes separately.
The growth percentages above are assumptions for testing value, not management guidance. Public disclosures do not allow us to prove that a rupee of Vicks sales earns more or less profit than a rupee of Whisper sales.
How a product sale becomes profit
The shelf price and the company’s revenue are different amounts
A customer buys a pack through a retailer or online channel. The company’s recorded revenue reflects its own sale terms, after the relevant discounts and deductions. Retail spending, distributor orders and the company’s shipments can therefore move differently in a particular quarter.
| For every ₹100 of company sales | Approximate amount | What the money pays for |
|---|---|---|
| Materials, purchased products and inventory | ₹37.79 | The physical products sold |
| Employees | ₹5.21 | People and operating support |
| Advertising and promotion | ₹12.66 | Brand communication, launches and promotional activity |
| Other operating costs | ₹19.02 | Including processing, royalties, freight and services |
| Depreciation | ₹0.89 | The accounting cost of using long-lived assets |
| Operating profit | ₹24.43 | Profit before financing, other income and tax |
These are trailing-twelve-month figures to June 2026, not the weaker June quarter alone. Operating profit is also called EBIT. Income tax and financing still have to be considered before reaching net profit. [S1-S2]
P&G’s parent relationships provide capabilities and also create costs. Royalties, purchases, processing and service charges are already included in reported profits. A shareholder needs to assess the cash left for the listed company after paying these costs.
Finally, profit is not all immediately distributable cash. Inventory, customer credit, supplier payments and factory investment affect cash flow. Dividends are distributions to shareholders; paying a large dividend does not itself make the underlying business more valuable.
What has happened to the share price?
A large decline, with the dates and comparison bases made explicit
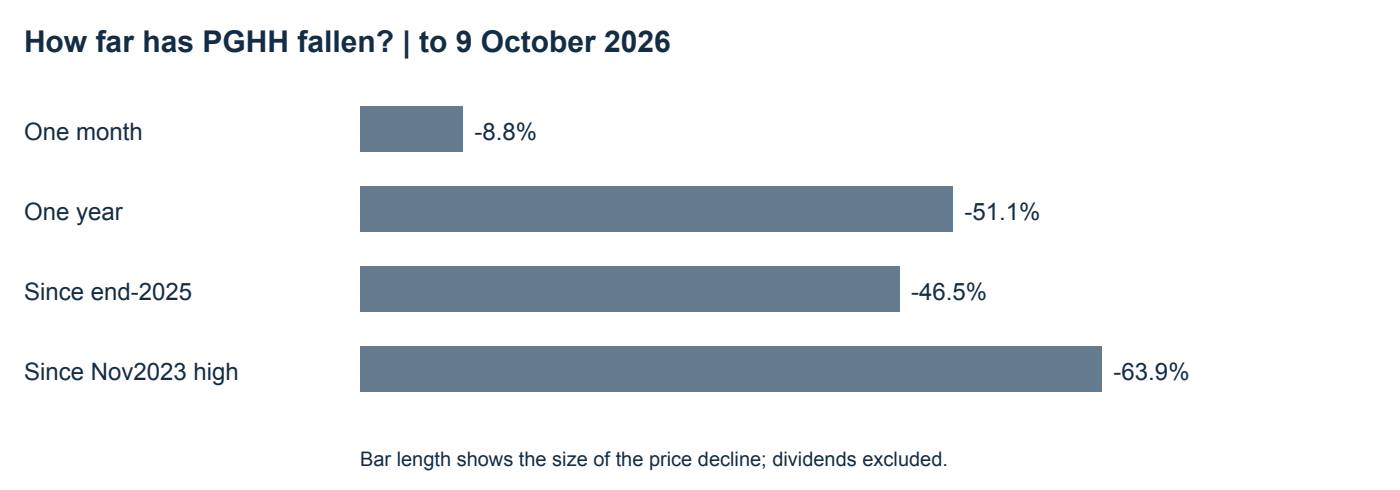
| Comparison | Earlier price | Price change |
|---|---|---|
| 9 Sep 2026 to 9 Oct 2026 | ₹7,615.00 | -8.8% |
| 9 Oct 2025 to 9 Oct 2026 | ₹14,194.00 | -51.1% |
| End-2025 to 9 Oct 2026 | ₹12,971.00 | -46.5% |
| Nov2023 intraday high to 9 Oct 2026 | ₹19,250.00 | -63.9% |
For scale, ₹1 lakh invested at the 9 October 2025 closing price would be worth about ₹48,912 at the 9 October 2026 close, before dividends and costs. The one-month and one-year starting closes are from archived NSE data; the end-2025 close is a labeled secondary-source observation. [S11-S13, S29]
12 October update: Upstox displayed ₹6,976.50 at 15:29 IST, up ₹34 or 0.49% from the prior close. This is a provider-displayed intraday quotation, not an independently verified official closing price. The historical comparisons and valuation workbook above retain the verified 9 October reference. [S35]
Why can strong brands have a weak share price?
Business performance and the price investors pay are separate questions
A share price reflects both the company’s earnings and how much investors are willing to pay for those earnings. A business can remain profitable while its share price falls if growth disappoints or investors become less willing to pay a high premium.
| What the evidence shows | What it means for an investor |
|---|---|
| Matched full-year sales were broadly flat. | The company was not yet converting the category opportunity into strong overall sales growth. |
| June2026 sales and profit fell year on year. | Lower revenue, higher materials expense and more advertising put near-term earnings under pressure. |
| The old share price carried a much higher earnings multiple. | Investors had little room for disappointment unless growth lasted a long time or their required return was low. |
| The current price is far below the 2023 high. | Expectations have reset substantially. That alone does not establish today’s fair value. |
A hypothetical example: earnings of ₹100 per share valued at 60 times earnings give a ₹6,000 share price. If earnings rise to ₹120 but the valuation falls to 30 times, the share price becomes ₹3,600. The business earned more, yet the share price fell 40%. This is an explanation of the mechanism, not PGHH’s actual historical calculation.
For PGHH, current TTM earnings exceed the FY2023 earnings used in the historical comparison, while the share price is much lower. That is consistent with a large reduction in the valuation premium. It does not prove exactly how much of the fall was caused by competition, interest rates, expectations or any single announcement.
The constructive case is that category adoption, better products and effective spending restore growth. The cautious case is that more competition makes that growth slower or more expensive. Both deserve testing against evidence.
The latest quarter in context
June 2026 versus the same quarter in earlier years
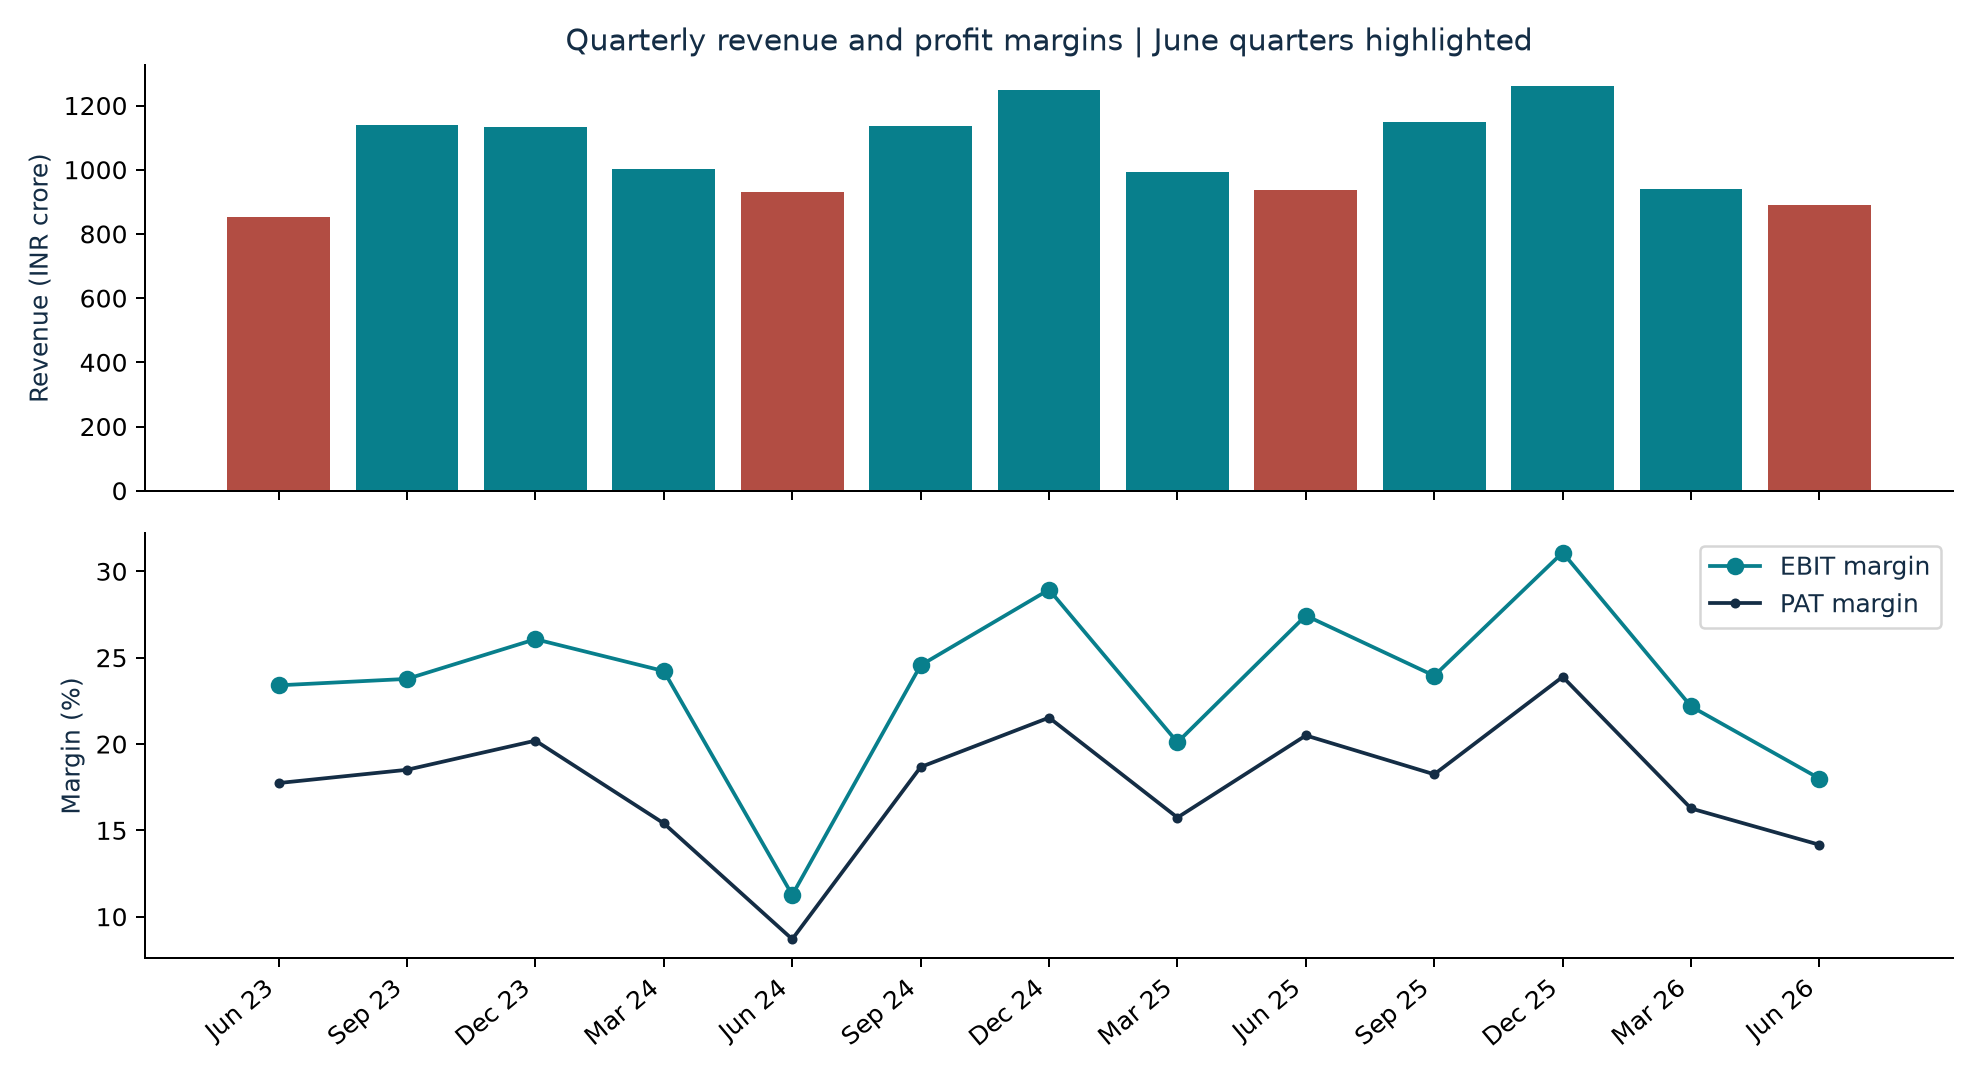
| Metric | June 2025 | June 2026 | Change |
|---|---|---|---|
| Operating revenue | 937.03 | 891.46 | -4.86% |
| EBIT | 257.08 | 160.47 | -37.58% |
| EBIT margin | 27.44% | 18.00% | -9.43 percentage points |
| EBITDA margin | 28.41% | 19.08% | -9.33 percentage points |
| PAT | 192.06 | 126.27 | -34.25% |
June 2026 revenue is below June 2024’s INR931.75 crore and June 2025’s INR937.03 crore, but above June 2023’s INR852.53 crore. June 2024 was itself a weak profit quarter. A quarter-on-quarter comparison would mix seasonality with performance. [S2–S4]
Why the margin fell
An exact accounting bridge separates facts from explanations
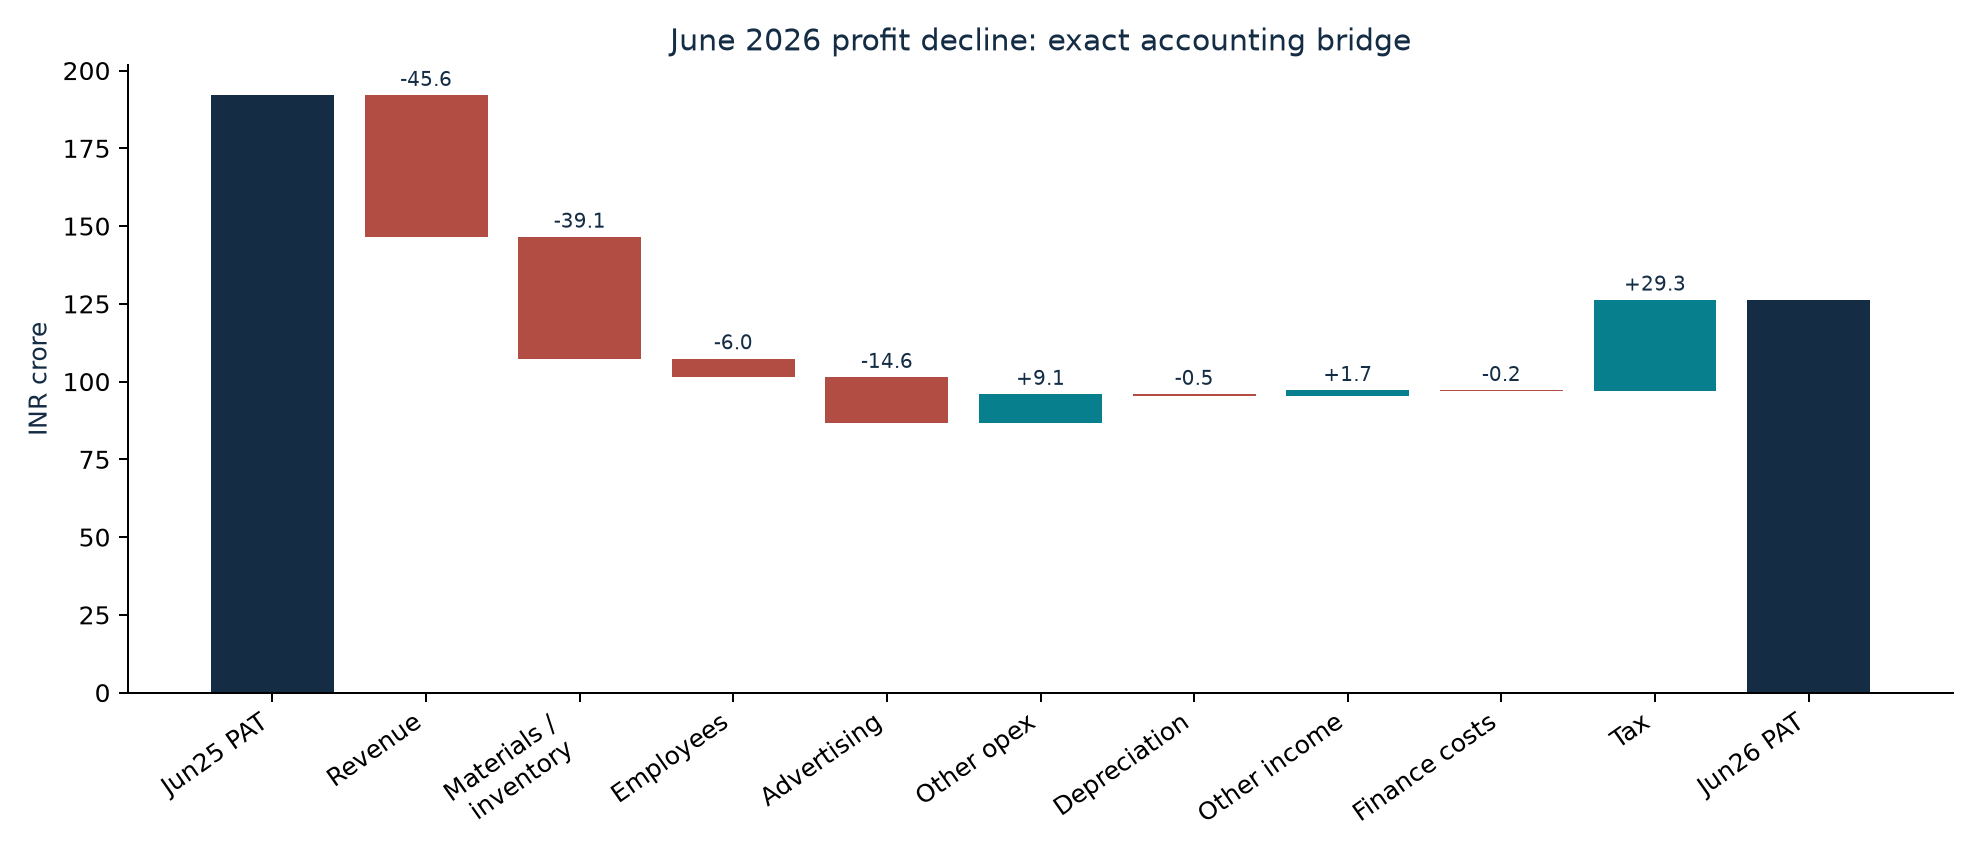
| Main operating movement | Profit effect | Interpretation |
|---|---|---|
| Revenue | -45.57 | Lower reported sales; no public brand/volume-price-mix bridge |
| Materials / traded inventory | -39.08 | Cost rises despite lower revenue; ratio 42.65% versus 36.41% |
| Advertising / promotion | -14.59 | Ratio 9.35% versus 7.34%; additional consumer investment |
| Employees | -6.01 | Higher cost; operational leverage works against sales decline |
| Other operating expenses | +9.14 | Partial offset; not all expenses increased |
Other income adds 1.74, depreciation subtracts 0.50, financing subtracts 0.20 and lower tax adds 29.28. These effects bring the total PAT change to-65.79. Higher materials expense can reflect input inflation, purchased-product mix, production and inventory movements; the financial statements do not isolate each contribution.
How to read the valuation
Start with the assumptions, then look at the answer
| Model term | Plain-English meaning |
|---|---|
| DCF: discounted cash flow | Estimate future cash the business can generate, then translate it into today’s value. |
| Required return | The annual return used to compensate for time and investment risk. A higher rate produces a lower present value. |
| Terminal growth | The slower long-term growth assumed after the detailed forecast ends. |
| Market share by value | The proportion of category spending captured by the brand; different from its proportion of units sold. |
| Scenario | One internally consistent set of assumptions, not a prediction with a known probability. |
| Margin of safety | A discount to an estimated value that an investor may require to allow for mistakes and bad outcomes. |
Bias check: the saved central case assumes a temporary share decline, a reduction in company receipts relative to retail spending and extra advertising. Those choices lean conservative and could overlap. The 11.7% required return is also a judgment. The resulting ₹3,441 should be read as a conservative conditional estimate, not a proven neutral fair price.
The model also assumes recovery: share eventually returns to its starting level and operating margin improves from the latest weak quarter. The net effect of all these choices matters. “Checked twice” means the evidence and calculations were reviewed; it does not mean the assumptions are free of bias.
The detailed sections that follow retain the existing model calculations and sensitivities. This is an editorial and explanatory revision, not a newly calibrated valuation. Start with the business and recent results; use the technical sections to challenge the assumptions that matter most to you.
How category growth becomes Whisper revenue
The starting company revenue already contains its market share
Domestic sanitary revenue in year t = starting domestic sanitary revenue × category retail-value index / 100 × share in year t / starting share × producer-capture index. Exports are forecast separately. Do not multiply PGHH’s existing sanitary revenue by 47% again: that would count the share reduction twice.
| Model issue | Version 3 treatment |
|---|---|
| Whisper share | 47% is a 2025 broad menstrual-care retail-value proxy. Current pad-only 44% is unverified. |
| Starting revenue | 65% of TTM revenue = INR2,759 crore. Base domestic allocation INR2,671 crore; exports INR88 crore. |
| Category growth | Category value growth already includes category volume and price/mix. No second brand-price uplift is added to a value-share forecast. |
| Producer / retail difference | Capture index begins at 1.00 and falls to 0.985 by Y3 in the base case. It is an explicit assumption covering realization, scope and timing, not an observed retail margin. |
| Extra execution drag | Removed the former -6%/-2% multipliers. Temporary share dip and capture index now carry the stated assumptions. |
| Innovation | No additional period-pants bonus on top of category growth and share. Cannibalization is a risk to the proxy. |
A stable share and capture index with an 8% category increase produces exactly 8% domestic revenue growth. A move from 47% to 42% over five years is a 10.6% relative share loss, or about 2.2% a year before category growth. It is not five percentage points of lost revenue growth every year.
This avoids relying on an unverified absolute retail market size. An absolute market-sizing cross-check still requires aligned category, tax, trade-margin, export and period definitions. That evidence gap remains visible.
How income and adoption could grow the market
Affordability supports runway; it does not establish a causal elasticity
Euromonitor’s public India summary reports 2025 menstrual-care retail value growth of 8% and volume growth of 7%, with Whisper at 47% value share and J&J brands at 35%. It describes Whisper’s share as only one percentage point lower than 2020. That evidence challenges a claim of a large, already-established historical share collapse. It does not answer what happened in the June 2026 quarter. [S23]
| Market | 2024 GDP/person PPP, approximate | 2025 category signal |
|---|---|---|
| India | 10,719 international dollars | Value +8%; volume +7% |
| Indonesia | 16,472 | Value +7%; volume +5% |
| China | 27,140 | Volume described as slightly lower |
| Japan | 54,156 | Value +3%; volume -2% |
These are contextual comparisons from World Bank and country category summaries [S24, S30–S32], not a matched panel or a regression. Demographics, saturation, product mix, culture and channels differ. Income cannot be treated as the sole explanation of category growth. [S24]
NFHS-5 reports sanitary-napkin use among women aged 15–24 at 64.4%, with 41.7% in the lowest wealth group and 83.1% in the highest; rural 58.9% versus urban 77.5%. Multiple methods can be reported. These are not paid-pad penetration estimates for all menstruating women. They support an access/affordability hypothesis without measuring PGHH’s obtainable revenue. [S25]
Central model assumptions: real income/person +5%, income elasticity 0.65, residual adoption/usage +2%, relevant population +0.5%, category price/mix +2%. Their multiplicative combination yields 7.93% structural category value growth. Y1 is deliberately 6%; Y2–5 use 7.93%; Y6–10 fade to 4%. The price elasticity 0.5 applies only to deviations from the 2% pricing baseline. Adoption is residual to income, so the two inputs must not describe the same demand uplift.
What if Whisper gains or loses market share?
Your ±5-point test is retained and made explicit
The central share path is 47% initially,46% in Y1,45.5% in Y2,46% in Y3,46.5% in Y4 and 47% in Y5. This is a temporary competitive setback followed by recovery, not an observed share series or a promise that P&G wins share back.
The joint simulation uses a normal year-five share change with mean 0 and standard deviation 2.551 percentage points. Thus 42%–52% is approximately the central 95% band around 47%, not a hard bound. A confirmed 44% base would imply 39%–49% for the same ±5-percentage-point convention. A relative ±5% around 44% would instead be 41.8%–46.2% and is a different test.
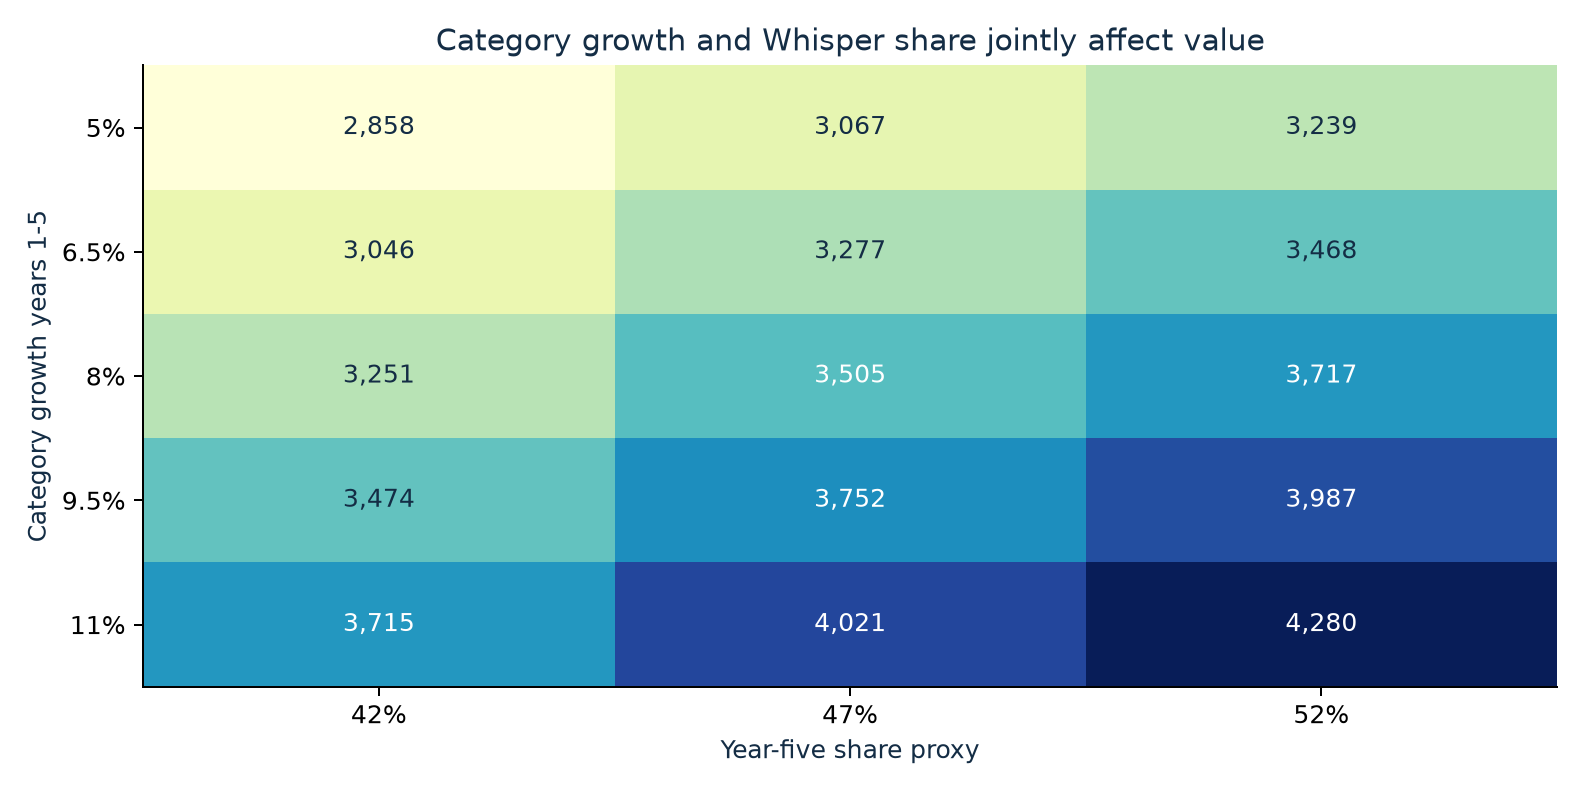
At 8% category growth and 47% ending share, modeled Y5 domestic sanitary revenue is INR3,866 crore and value is INR3,505/share. At 42% it becomes INR3,455 crore and INR3,251/share; at 52%, INR4,277 crore and INR3,717/share. The costs of rebuilding share are included. Share alone does not justify the current market quotation.
What sales could look like over ten years
Base case • rolling years from the valuation date
| Year | Category growth | Share proxy | Domestic pads | Total pads¹ | PGHH sales |
|---|---|---|---|---|---|
| 1 | 6.0% | 46.0% | 2,757 | 2,849 | 4,404 |
| 2 | 7.9% | 45.5% | 2,929 | 3,024 | 4,653 |
| 3 | 7.9% | 46.0% | 3,180 | 3,279 | 4,984 |
| 4 | 7.9% | 46.5% | 3,469 | 3,572 | 5,358 |
| 5 | 7.9% | 47.0% | 3,784 | 3,891 | 5,763 |
| 6 | 7.1% | 47.0% | 4,055 | 4,166 | 6,124 |
| 7 | 6.4% | 47.0% | 4,313 | 4,428 | 6,474 |
| 8 | 5.6% | 47.0% | 4,553 | 4,673 | 6,807 |
| 9 | 4.8% | 47.0% | 4,771 | 4,896 | 7,119 |
| 10 | 4.0% | 47.0% | 4,962 | 5,092 | 7,404 |
¹Total sanitary/femcare proxy includes exports; it is not reported brand revenue. The base begins with INR4,245 crore TTM company sales and reaches INR5,763 crore in Y5:6.3% annual growth. Domestic sanitary revenue rises from INR2,671 crore to INR3,784 crore; exports rise from INR88 crore to INR107 crore.
The producer-capture index falls 0.5% of its starting level each year through Y3 and then stays at 0.985. Royalty and operating cost ratios are applied to company revenue after this bridge; no additional price realization deduction is hidden in sales.
The branded category and the product-class mix are imperfectly aligned. Sensitivities test sanitary weight 63%–67%, export allocation from zero to all company exports attributed to sanitary products, and capture change of-5% to+2%. Only the direction and economic identity are robust; the exact allocations need company or syndicated-data confirmation.
Why did revenue fall?
The public evidence explains the setting, not a precise brand attribution
- Verified: operating revenue fell 4.86% in the June quarter; annual aligned revenue was already broadly flat. The cost and advertising changes are separately observable.
- Management explanation: the July 29 release refers to commodity/geopolitical pressure and increased innovation/advertising investment. The June 16 call discusses changing consumer needs, channels, competition and healthcare demand. It predates the June quarter end. [S7, S26]
- Reasonable hypotheses to test: competitive share or mix pressure, channel/retail-to-shipment differences, affordability, category timing, and Vicks seasonality. None has a disclosed contribution to the 45.57 crore sales decline.
- Evidence against a simple collapse story: the 2025 category source describes Whisper’s five-year value-share loss as about one point. That is not proof of a large 2026 loss. The current 44% assertion remains unverified.
- What would resolve it: a matched quarterly series for pad-only retail value/volume share, PGHH domestic shipments and net realization, and healthcare sales. Distributor stock levels would help distinguish consumption from shipment changes.
Source correction: the company archive PDF labelled June 2026 press release contains a March-quarter release. The correct July 29 document is on NSE. Its INR901 crore “sales” wording matches total income 900.89 rather than statutory operating revenue 891.46. The statutory result controls this model. [S2, S26]
We therefore do not force the entire decline into Whisper share loss. We model a temporary share dip and a separate, modest capture adjustment, and show how value changes if either assumption is removed.
Ten years of revenue and margins
Past recovery is evidence of capability, not a forecast guarantee
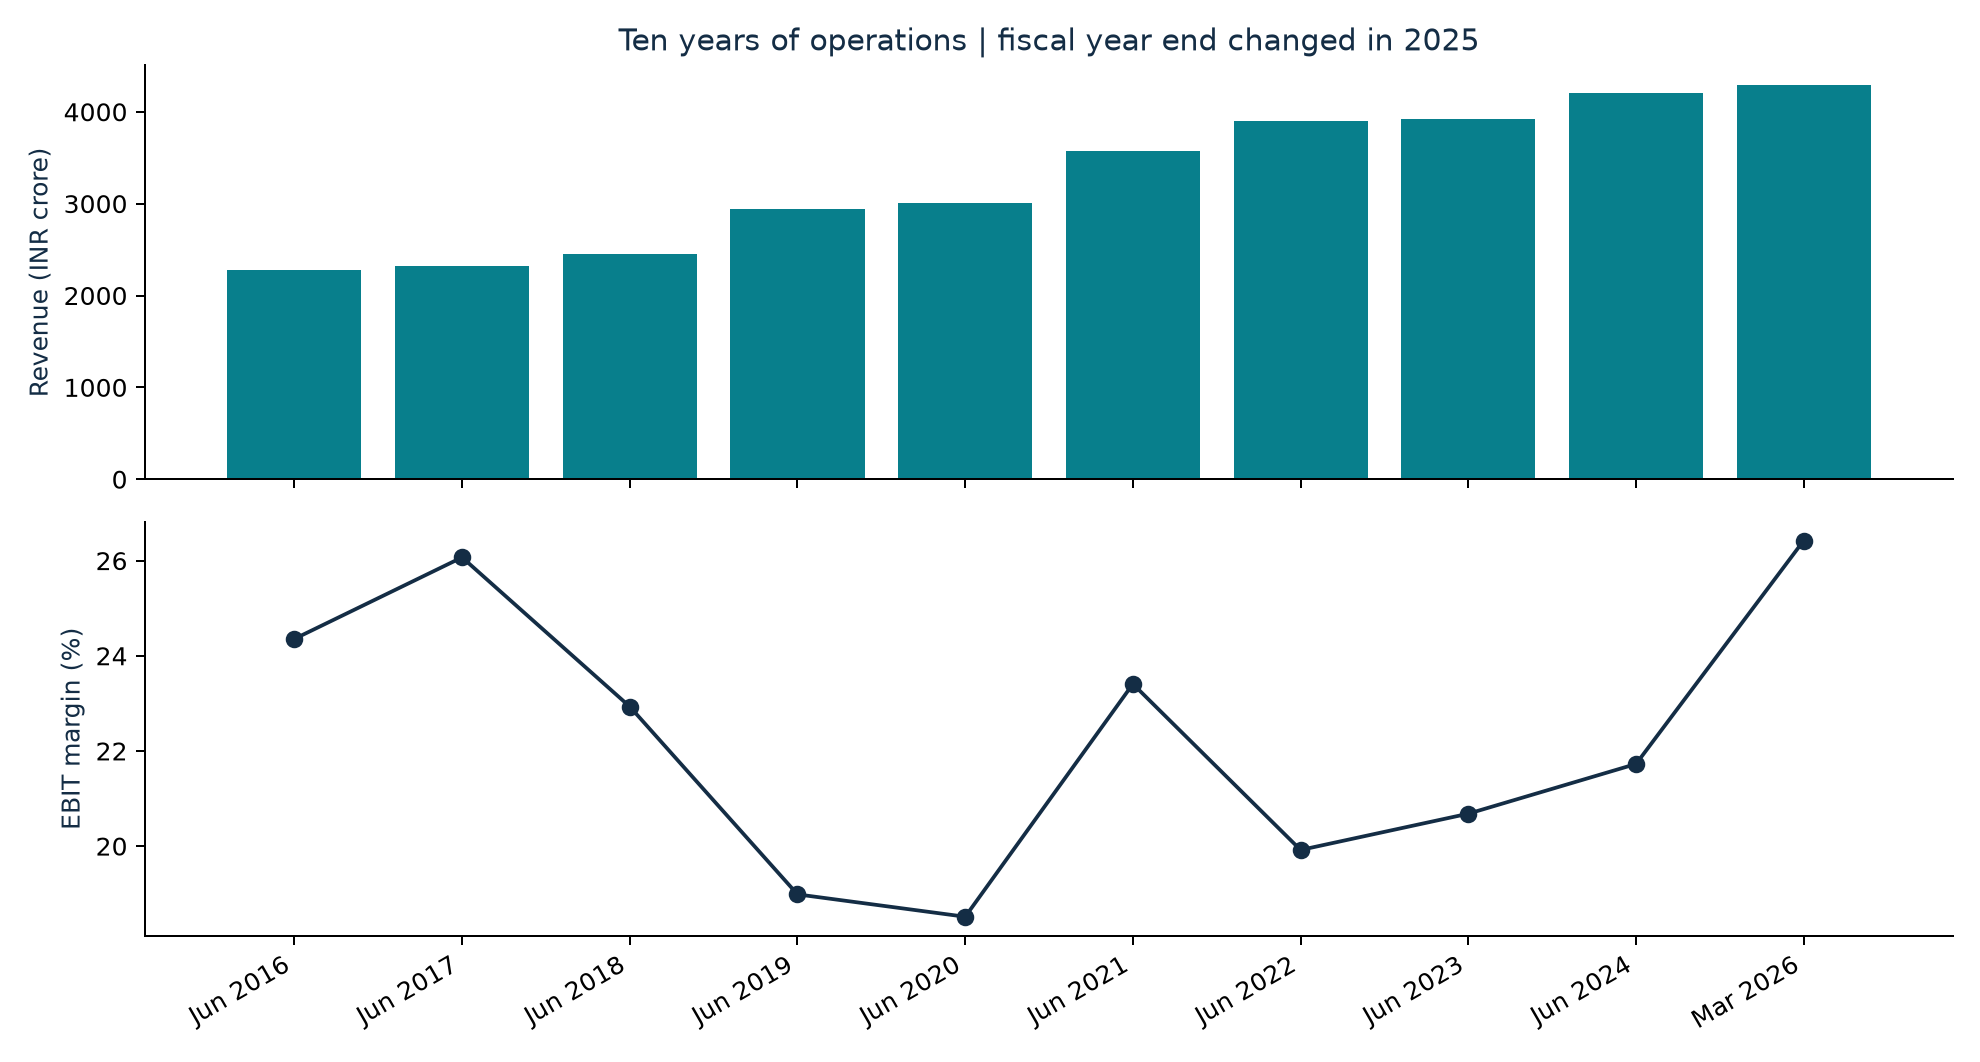
FY2026 revenue of INR4,290.42 crore is not comparable with the nine-month FY2025 figure of INR3,374.42 crore. Adding June 2024 gives a matched April 2024–March 2025 base of INR4,306.17 crore: FY2026 sales fell 0.37%, while PAT grew 19.35%. June 2026 TTM sales are INR4,244.85 crore and PAT INR790.71 crore. [S1–S4]
The latest annual improvement was largely profit and cost performance on flat sales. The June quarter then reversed part of that margin strength. Freezing the FY2026 peak margin would overstate the evidence for durable earnings growth.
The historical record
Financial periods are explicitly labeled
| Period | Months | Revenue | EBIT margin | PAT |
|---|---|---|---|---|
| Jun 2016 | 12 | 2,275 | 24.4% | 422 |
| Jun 2017 | 12 | 2,320 | 26.1% | 433 |
| Jun 2018 | 12 | 2,455 | 22.9% | 375 |
| Jun 2019 | 12 | 2,947 | 19.0% | 419 |
| Jun 2020 | 12 | 3,002 | 18.5% | 433 |
| Jun 2021 | 12 | 3,574 | 23.4% | 652 |
| Jun 2022 | 12 | 3,901 | 19.9% | 576 |
| Jun 2023 | 12 | 3,918 | 20.7% | 678 |
| Jun 2024 | 12 | 4,206 | 21.7% | 675 |
| Mar 2025 | 9 | 3,374 | 24.9% | 637 |
| Mar 2026 | 12 | 4,290 | 26.4% | 856 |
EBIT = profit before tax − other income + finance costs. Reported impairments remain in this historical series. FY2016–2017 are restated Ind AS comparatives in the 2017 report, with excise excluded from revenue; management’s GST-comparable growth series is different. FY2018 management reported 10% comparable sales growth, which should not be confused with this chart’s statutory change. [S27–S28]
Cash conversion has also varied: CFO/PAT was about 0.70× in FY2024 and 1.08× in FY2026. Supplier funding and inventory movements can make one year look unusually strong or weak. A sustained forecast needs working-capital assumptions, not just an earnings multiple. [S1, S4]
Earlier challenges: 2018 and 2020
What management did, and what actually followed
| Episode | Response and subsequent evidence | Share-price context |
|---|---|---|
| 2018: investment and transition | PAT fell 13.4%. Management invested in products, advertising and distribution during the GST transition; Choice/Ultra Soft and consumer education supported the offer. FY2019 sales grew 20.0% and PAT11.9%, but EBIT margin fell further from 22.9% to 19.0%. Profit recovery did not mean full margin recovery. | Calendar 2018 price +5.2%;2019 +15.8%. These broad returns cannot identify the effect of the operating response. |
| 2020: COVID disruption | Lockdowns disrupted operations and supply. The company prioritized continuity and consumer access. FY2020 sales +1.9%, PAT +3.3%; FY2021 sales +19.1%, PAT +50.5%, EBIT margin 23.4%. Reopening and healthcare demand make this an imperfect analogue. | Calendar 2020 price -3.3%;2021 +39.6%. The issuer’s March 2020 monthly low was INR8,400. Recovery occurred alongside a wider market rebound. |
Sources: FY2018,2020 and 2022 reports; monthly issuer price tables; secondary calendar closes. Statements of action are management-reported. No controlled estimate of marketing effectiveness or benchmark-adjusted event effect is claimed. [S5–S6, S27–S29]
Learning: management has previously funded product and distribution improvements through weak profit periods. The length and quality of the payoff varied. An analyst should distinguish recovery in revenue, operating margin, net profit and the shareholder’s entry price.
Earlier challenges: 2022 and 2024
Cost inflation and marketing timing produced different recoveries
| Episode | Response and result | Price context |
|---|---|---|
| 2022: input inflation | FY sales rose 9.1% but PAT fell 11.7%. Pricing, productivity, value offerings such as Choice Nights and Vicks innovations were the response. FY2023 sales were almost flat; EBIT rose 4.3%. PAT +17.8% partly reflected favorable tax, so it was not wholly an operating rebound. | Calendar 2022 price -6.0%;2023 +19.5%. The 2023 high came despite modest underlying revenue growth. |
| June 2024: spending spike | Advertising 153.71 crore versus 53.54 crore, plus 13.03 crore impairment. PAT81.06 crore versus 151.24 crore. June 2025 PAT rebounded to 192.06 crore as advertising fell to 68.73 crore. Spending timing made the comparison unusually strong. | Calendar 2024 price -15.3%;2025 -11.8%. Improving later profit did not prevent valuation compression. |
| June 2026: combined pressure | Lower sales, higher material expense and renewed ad investment. Management cites macro costs and innovation support. A repeat recovery is possible; the reported post-June evidence in this analysis does not yet establish it. | 9 Oct 2026 close INR6,942.50, approximately 63.9% below the Nov 2023 intraday high of INR19,250. |
Sources: annual/quarterly reports and company calls [S1–S5, S9–S10, S26]; prices [S11, S29]. Fiscal operating periods and calendar returns are deliberately distinguished. Price outcomes are associations over broad intervals, not causal estimates of each management action.
Shareholders and the price paid
A recovering business can still be a disappointing investment
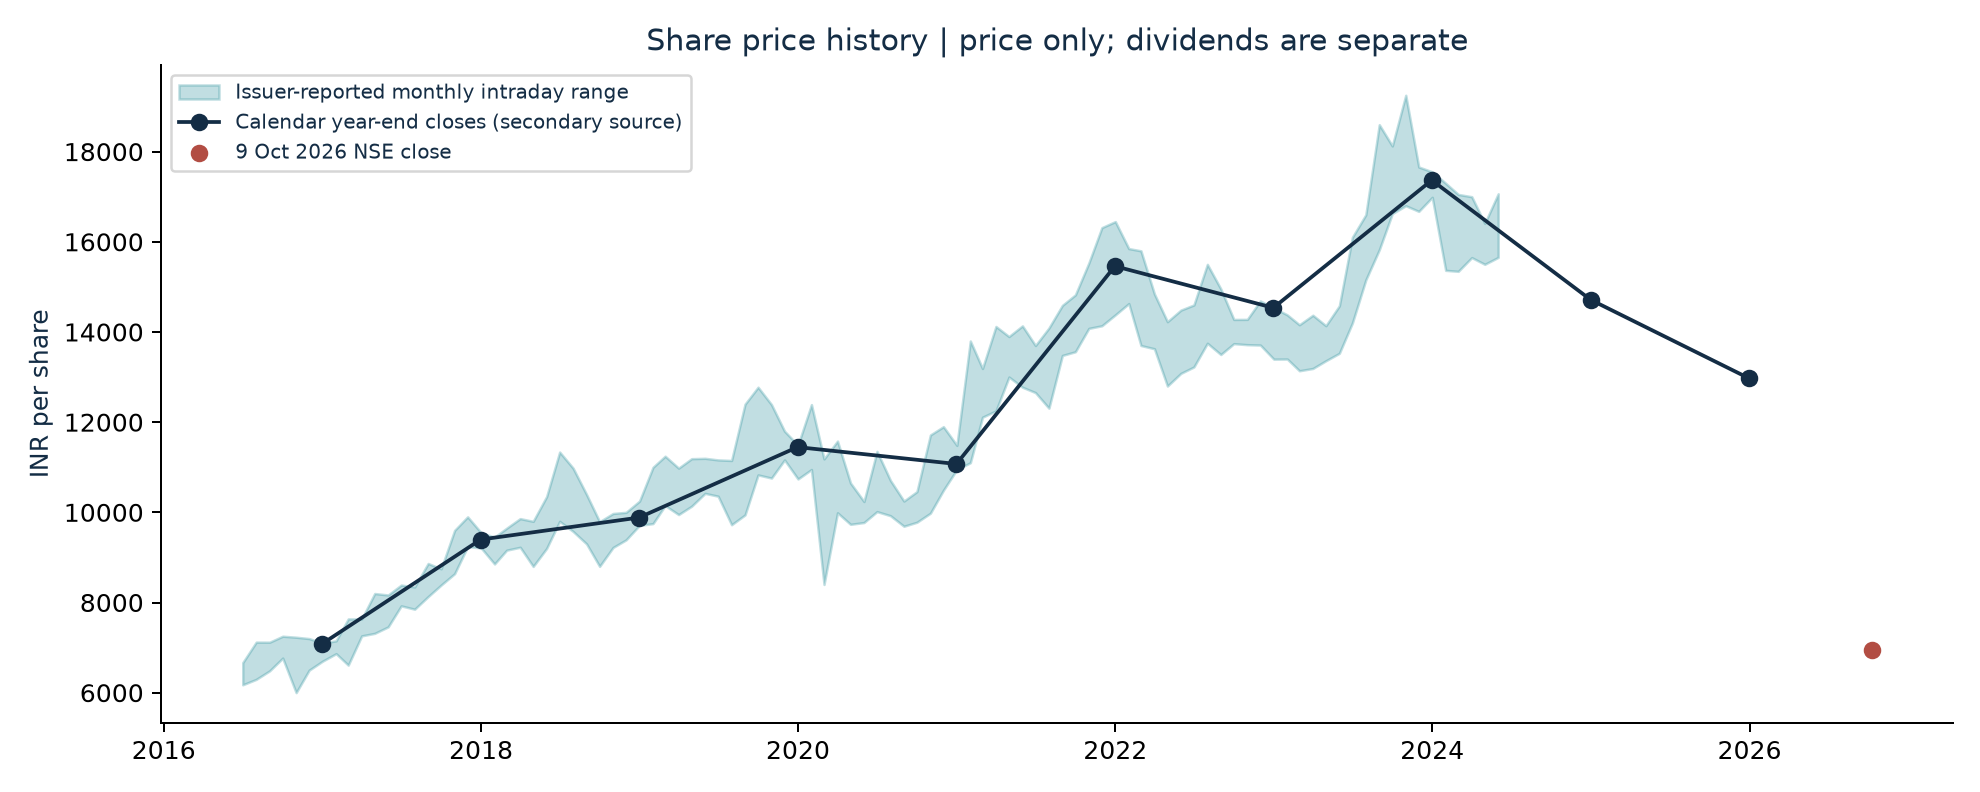
The highest observed price in the archived issuer monthly series is INR19,250 in November 2023. The 9 October 2026 close is 63.9% below that level. This is a high-to-current drawdown, not a total return and not proof that any one earnings event caused the decline.
An investor at the secondary-source 2016 year-end close of INR7,084.05 would have a price-only loss of about 2.0% at INR6,942.50. Adding INR1,967 of subsequent gross cash dividends through the stated 2026 observation gives about 25.8% cumulative cash-inclusive return, with no reinvestment, taxes or fees. This is roughly 9¾ years, not an exact ten-year anniversary. [S29; current quote S11]
New NSE historical bulk-price downloads timed out. The report therefore uses archived primary monthly ranges and labels secondary calendar closes. An exact event study with corporate-action-adjusted daily returns and a benchmark remains unfinished evidence work; no abnormal-return claim is made.
What the previous high prices implied
Reverse valuation measures the hurdle; it does not reveal consensus
| Observed price point | Price | Published FY EPS¹ | P/E | EPS CAGR: 10 y | EPS CAGR: 20 y |
|---|---|---|---|---|---|
| 2016-12 | 7,200 | 130.16 | 55.3× | 23.4% | 15.2% |
| 2019-12 | 11,800 | 129.12 | 91.4× | 30.4% | 18.8% |
| 2021-12 | 16,314 | 200.79 | 81.2× | 28.8% | 18.0% |
| 2023-11 | 19,250 | 208.91 | 92.1× | 30.5% | 18.8% |
| 2026-10 close | 6,942.50 | 243.59 | 28.5× | 14.3% | 10.3% |
¹Historical observations use the then-published completed fiscal year’s EPS, not a reconstructed point-in-time TTM. Prices are monthly intraday highs. The current row uses June 2026 TTM. These choices are transparent but make the diagnostic coarser than a full historical DCF.
Common assumptions: 11% required return,90% payout,4% perpetual EPS growth after either 10 or 20 years of constant excess growth. The 2019/2023 highs need roughly 30% annual EPS growth for 10 years, or about 19% for 20 years. A lower required return would reduce that hurdle. Those are alternatives, not uniquely identifiable market expectations.
The reverse identity is price/EPS = discounted 90% payouts during the growth period + discounted terminal payouts at 4% growth. Historical cash and special payouts are not separately valued. FY2023 EPS includes a favorable tax effect, which can make the apparent core P/E lower than a normalized measure.
Has something changed? Yes. Current earnings are above FY2023 earnings, while the price is far lower. A large repricing of the duration/quality premium is evident. Recent flat sales and the June margin setback challenge an effortless growth narrative. Is permanent brand impairment established? No. Price alone cannot answer that question.
Management record and capital allocation
Separate what management achieved from what remains a hypothesis
| Date | Management message | Observed result and lesson |
|---|---|---|
| September 2023 | Near-half feminine-care share; over-half cough/cold share; INR 105 crore productivity savings | Share/cost-savings claims are not a sustained entity growth series. Tax benefits also complicate FY2023 PAT. |
| September 2024 | Double-digit feminine-care category growth expected over three years; urban penetration around 60% and rural below 40% | The period is not complete, but later company sales do not yet validate automatic capture of that category runway. |
| June 2025 | Nine-month comparable sales growth 3% and structural profit growth 7% | Positive operating progress, but the subsequent full-year comparable sales result was flat. |
| June 2026 | Flat sales, PAT growth 19%; period-panty units above 10 crore and business tripled | Rounded company profit claim matches the reconstruction. Launch revenue, profitability and cannibalization remain undisclosed. |
| July 2026 result | June quarter filing after the call | Revenue fell 4.86%, PAT fell 34.25%; this weakens an immediate-recovery claim, without proving permanent decline. |
Capital allocation has emphasized distributions. FY2026 cash dividends paid were INR 843.97 crore, while total declared dividend for FY2026 was INR 827.75 crore using INR 255 times 3.2460736 crore shares. Those are different measures because cash paid includes the prior fiscal year’s final dividend. A high payout explains part of the small equity base and very high reported return-on-equity figures. Those ratios cannot simply be used as the return on future incremental capital. [S1]
Parent-group transactions are economically central: FY2026 purchases from P&G Home Products were INR 661.26 crore; processing to Gillette Diversified Operations INR 201.56 crore; royalty to the US parent INR 188.16 crore; business-process outsourcing INR 99.94 crore. The P&L’s total royalty line is INR 188.41 crore, slightly different from the named-parent transaction. All are already charged in profits and are not deducted a second time in the DCF. [S1]
The statutory audit opinion and formal governance processes provide a starting point, not a personal integrity verdict. The annual report identifies litigation judgments as an audit focus. Public disclosures cannot fully assess distributor satisfaction, manager succession depth, employee relations or the fairness of every intercompany arrangement. Those remain explicit due-diligence gaps. [S1]
Promoters held 70.64% as at 31 March 2026. Minority investors depend on the board and related-party approval framework for fair participation in the listed entity’s cash flows. This concentrated ownership is a governance consideration, not an automatic numerical valuation discount. [S1, note 12.4]
Profit normalization and cash quality
The model retains the costs needed to sustain the brands
| FY2026 bridge | INR crore | Interpretation |
|---|---|---|
| PBT | 1,166.63 | Reported |
| Less other income | 42.47 | Cash interest and other non-operating items excluded from operating value |
| Add reported finance costs | 9.45 | Conventional EBIT reconciliation, not all ordinary bank interest |
| Conventional operating EBIT | 1,133.61 | 26.42% of revenue; compare with TTM about 24.43% |
| CFO | 924.08 | Includes INR 37.44 crore net working-capital release |
| Less gross cash capex | 49.54 | Asset-sale proceeds are not credited as recurring free cash flow |
| Simple CFO less capex | 874.54 | A historical screening measure, not normalized future FCF |
FY2026 advertising plus promotion was 12.18% of sales, versus 14.08% on the reconstructed prior-year base. Its INR 83.43 crore reduction was large relative to the INR 138.85 crore PAT increase. This comparison does not prove that all savings were caused by underinvestment, nor that all savings are recurring. The reported marketing line itself combines advertising and trade incentives; trade rebates deducted from revenue are a separate item. [S1–S3]
Finance costs include employee-benefit interest, tax interest and interest on trade payables. The final DCF treats employee-benefit obligations as a debt-like equity adjustment while keeping ordinary service costs within the operating-margin assumptions. The margin forecasts are before financing charges. This avoids both treating all finance costs as bank interest and ignoring the benefit liability. [S1, notes 15 and 24]
Version 3 uses the reported TTM expense totals and explicit future cost rules. The prior version’s prescribed 23.5% starting margin has been retired. BaseY1 EBIT margin 23.3% is now an output, with the assumptions and fixed/variable uncertainty visible.
What it costs to run the business
No preset company margin is required to make the base case work
| TTM expense | Amount | Share of sales | Forecast rule |
|---|---|---|---|
| Materials / inventory | 1,604 | 37.8% | Sales-linked; explicit macro and mix tests |
| Employees | 221 | 5.2% | Half scales with sales, half inflates 5% |
| Advertising / promotion | 537 | 12.7% | TTM ratio + near-term investment + share-recovery cost |
| Other operating expenses | 807 | 19.0% | Allocated by FY detail; fixed/variable split tested |
| Depreciation | 38 | 0.9% | 0.894% of sales |
Detailed other costs use FY2026 rates applied to TTM sales: royalty INR186.41 crore, processing 217.36, freight 84.49, energy 10.56, BPO98.88 and residual 209.54. These sum to the actual 807.23 crore bucket, but the suballocation is an estimate. [S1–S2]
Base extra advertising is 0.5 percentage point of revenue in Y1 and fades over three years. Every percentage point of share regained from the modeled trough adds 0.15 percentage point of ongoing marketing/revenue. Rebuilding 1.5 points therefore costs 0.225 percentage point of revenue by Y5. Share losses do not automatically cut marketing.
The model charges 50% of employee, BPO and residual costs as fixed with nominal inflation, and 50% as sales-linked. The split is not disclosed;0%–100% sensitivities are included. Brand profitability is unknown: ±5-point pad-versus-other contribution margin differences test the effect of changing mix rather than inventing brand profit statements.
How inflation and the rupee affect profits
Exposure, persistence and mitigation matter together
| Input | Central assumption | Sensitivity |
|---|---|---|
| Oil level shock | +10% incremental to TTM | -20% to+40% |
| Pulp shock | 0% | -15% to+15% |
| INR depreciation | +3% | -2% to+8% |
| Freight shock | +10% | -10% to+30% |
| Sourcing/productivity mitigation | 50% of gross modeled shock | 0% to 75% |
| Permanent share of shock | 25%; rest fades over 4 years | 0% to 100% |
| Extra royalty/revenue | 0 | +0.5 to+1.0 percentage point |
| Additional productivity savings | 0 | Up to 0.2% of revenue/year, capped after Y5 |
Assumed raw-material exposure weights: 35% pulp,45% oil-related and 60% currency; traded-goods weights 10%,15% and 20%. Oil cost pass-through coefficient 0.5. Freight and energy are separately mapped. Currency and commodity effects multiply; commodity exposure is not the entire cost of goods. These are analyst estimates, not a procurement disclosure.
The base net incremental first-year cost burden is about 0.59% of revenue after mitigation. Cost mitigation represents sourcing/productivity, not a free price increase. Category pricing affects demand through the revenue equation; no automatic full recovery is credited. Existing reported cost savings are already in TTM profitability and are not added again.
Oil and currency are positively correlated in the simulation by assumption. The cost shock’s permanent fraction is also varied. A low single-factor sensitivity should not be read as protection from a sustained competitive-price war or a larger unmapped commodity exposure.
Cash, investment needs and the return investors require
Owner cash flow must fund the business before distribution
| Equity bridge item | INR crore |
|---|---|
| March 2026 cash / liquid balances reviewed | 557.03 |
| Less subsequent INR60/share dividend | (194.76) |
| Less operating cash reserve | (150.00) |
| Less lease liabilities | (0.87) |
| Less employee-benefit provisions | (123.98) |
| Less recognized tax provision | (2.32) |
| Net addition to enterprise value | 85.10 |
This conservative bridge does not estimate post-March cash generation. The operating reserve and benefit deduction are sensitivity-tested; their treatment is judgmental and must not duplicate future normal expense. The full INR861.16 crore contingent-claim stress is separate from recognized tax provision and is not assigned a fabricated probability. [S1]
Operating tax 26%; initial cash capex 1.5% of sales; depreciation 0.894%. Opening operating working capital is-385.71 crore and converges to-7% of sales by Y5. Negative working capital is supplier funding, not permanently free cash. A zero-float stress is included.
Required return 11.7% nominal INR is an analyst hurdle, not a statistically measured WACC. The prior report’s bond/ERP/beta build is an explanatory cross-check, not precision evidence. Test 9.5%–13.5%. Terminal growth 4%, incremental return on capital 50%; test 3%–5% and 30%–75%. High book ROCE does not prove the terminal incremental return.
Terminal reinvestment is g/ROIC =8% of after-tax operating profit. Cash capex fades to the consistent terminal requirement in Y6–10; terminal FCF is 92% of terminal NOPAT. Marketing is already expensed, so it is not capitalized and deducted again. After year ten, the terminal model holds operating margin constant; this assumes expense growth converges to revenue growth rather than continuing the explicit period’s higher fixed-cost inflation indefinitely.
What the cash-flow model says the business is worth
The cost build and revenue forecast meet in free cash flow
| Year | Sales | EBIT | Margin | FCF | PV of FCF |
|---|---|---|---|---|---|
| 1 | 4,404 | 1,026 | 23.3% | 728 | 652 |
| 2 | 4,653 | 1,099 | 23.6% | 787 | 631 |
| 3 | 4,984 | 1,195 | 24.0% | 861 | 617 |
| 4 | 5,358 | 1,304 | 24.3% | 940 | 604 |
| 5 | 5,763 | 1,415 | 24.5% | 1,018 | 585 |
| 6 | 6,124 | 1,509 | 24.6% | 1,091 | 562 |
| 7 | 6,474 | 1,599 | 24.7% | 1,139 | 525 |
| 8 | 6,807 | 1,684 | 24.7% | 1,182 | 488 |
| 9 | 7,119 | 1,760 | 24.7% | 1,217 | 450 |
| 10 | 7,404 | 1,828 | 24.7% | 1,245 | 412 |
| Valuation bridge | INR crore / per share |
|---|---|
| PV of explicit cash flows | 5,525 |
| PV of terminal value | 5,560 |
| Enterprise value | 11,085 |
| Net equity adjustment | 85.10 |
| Shares, crore | 3.2460736 |
| Intrinsic value per share | 3,441 |
FCF = EBIT × (1 − tax) + depreciation − cash capex − change in operating working capital. About 50.2% of enterprise value comes from terminal value. The ten-year forecast ends at 24.7% EBIT margin versus 24.4% TTM and 18.0% in the latest quarter. It therefore contains a recovery assumption.
Recovery and downside cases
The favorable countercase is explicit
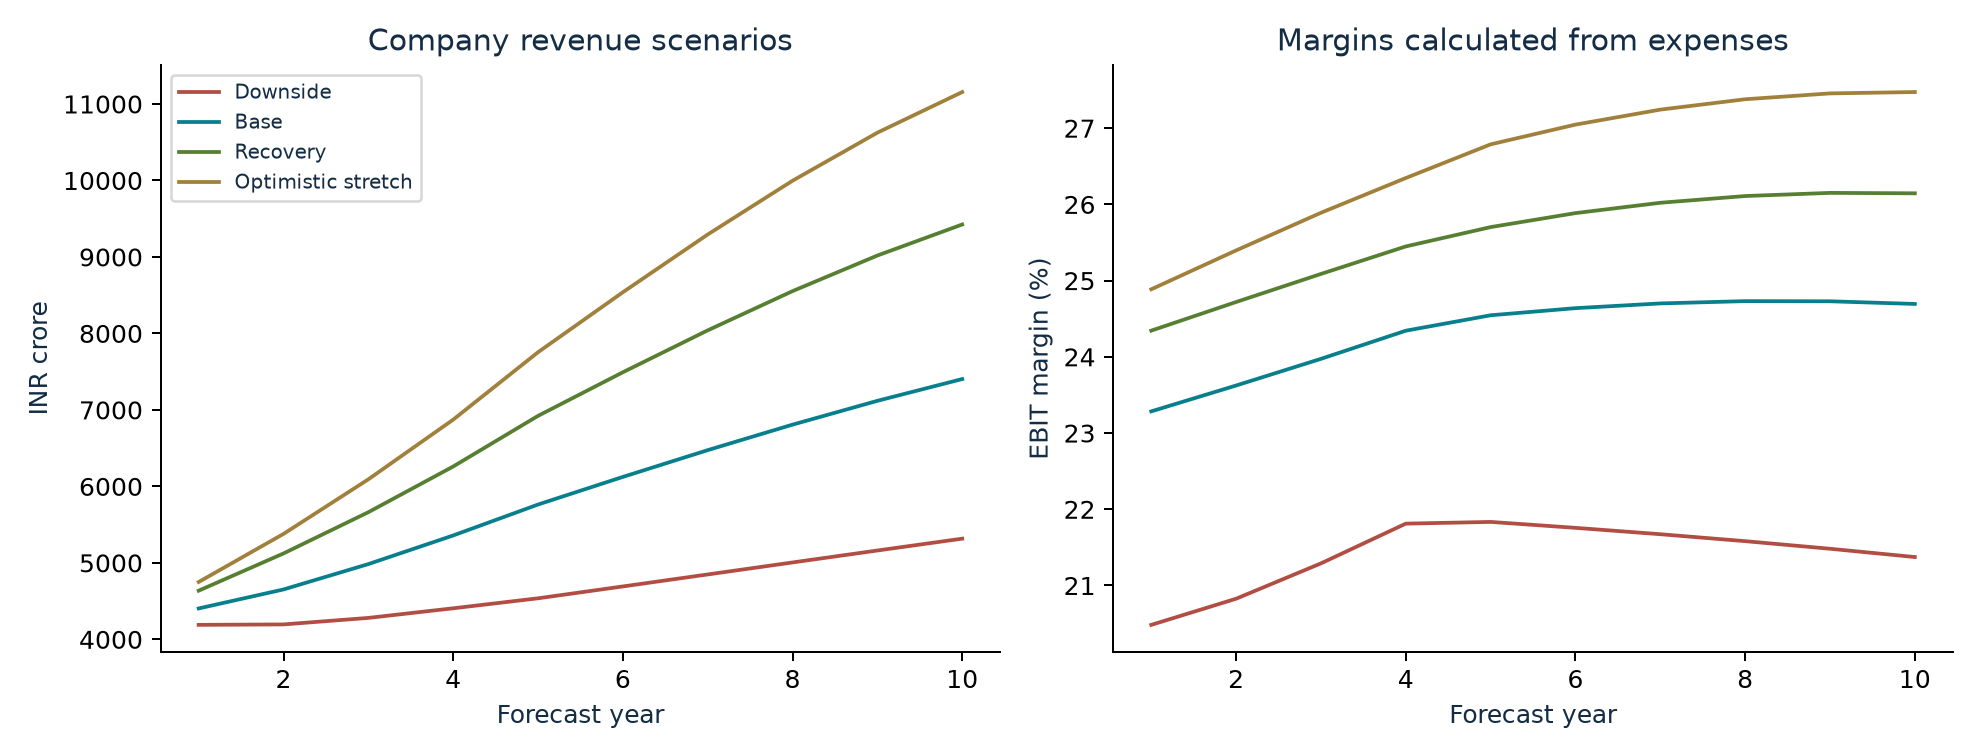
| Case | Year-five share | Structural category growth | Required return | Value |
|---|---|---|---|---|
| Base | 47.0% | 7.9% | 11.7% | 3,441 |
| Downside | 42.0% | 5.1% | 13.5% | 1,730 |
| Recovery | 52.0% | 10.0% | 10.5% | 5,687 |
| Optimistic stretch | 52.0% | 12.0% | 9.5% | 9,003 |
The downside combines weaker adoption and healthcare growth, a larger share dip/loss, more pressure on realization/costs and a higher required return. Recovery combines stronger category growth, share gains and better economics. Stretch also grants low discounting and sustained strong execution. It is an intentionally optimistic challenge to the central conclusion, not a price target.
The saved workbook labels are retained for traceability. “Optimistic stretch” is the highest-growth/lower-required-return case; the label is not evidence that its outcome has a measured low probability.
What moves the valuation
Single-input tests hold the remaining central assumptions constant
| Driver | Lower / central / upper test | Value range |
|---|---|---|
| Y5 share change | -5 pp /0 /+5 pp | 3,194 /3,441 /3,648 |
| Real income/person growth | 3% /5% /7% | 3,275 /3,441 /3,617 |
| Income elasticity | 0.35 /0.65 /0.95 | 3,247 /3,441 /3,653 |
| Residual adoption/usage | 0% /2% /3% | 3,183 /3,441 /3,580 |
| Rubs growth | 0% /4% /8% | 3,281 /3,441 /3,640 |
| Cough-drops growth | 2% /7% /12% | 3,347 /3,441 /3,563 |
| Tablets growth | -2% /3% /8% | 3,422 /3,441 /3,466 |
| Required return | 9.5% /11.7% /13.5% | 4,839 /3,441 /2,780 |
| Terminal growth | 3% /4% /5% | 3,206 /3,441 /3,744 |
| Terminal incremental return | 30% /50% /75% | 3,318 /3,441 /3,503 |
The workbook retains all individual tests, including mix, exports, producer capture, macro costs, marketing, royalties, working capital, cash reserve and contingencies. Saved sensitivity outputs do not automatically refresh when live inputs change; the Summary sheet flags that rebuild requirement.
Changing the starting share from 47% to 44% while holding actual starting sales and a flat eventual share does little to value: the share ratio, not the isolated starting level, drives future revenue. Current share is essential to defining the market and testing future change; it is not an independent haircut to already-reported company revenue.
What the computer scenarios can and cannot tell us
Five thousand conditional states broaden the test
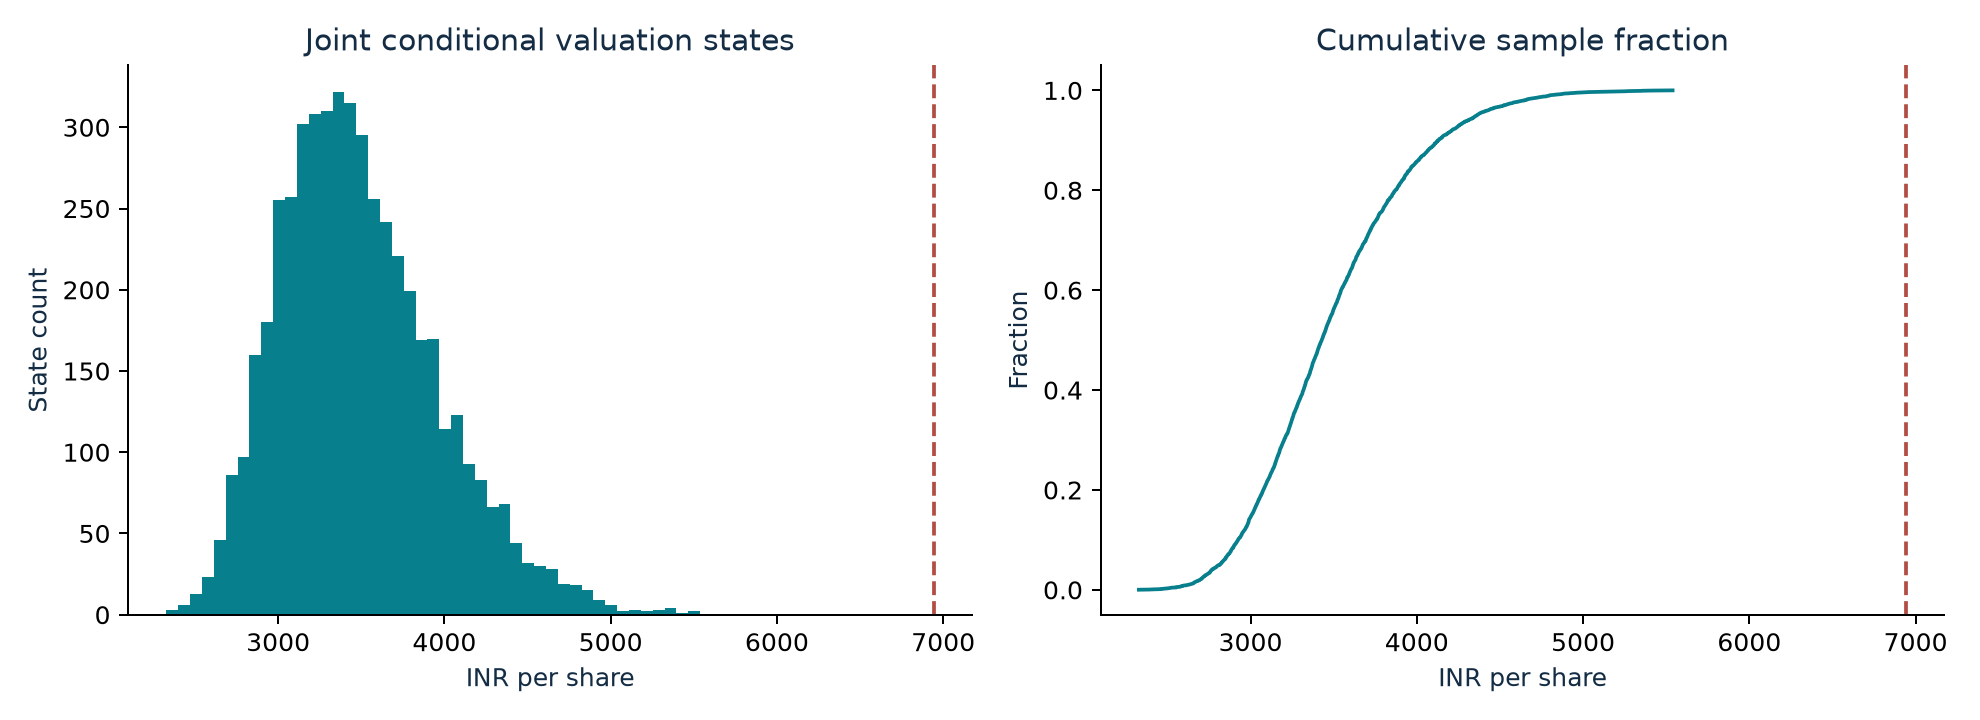
| Percentile | 5 th | 25 th | Median | 75 th | 95 th |
|---|---|---|---|---|---|
| Value / share | 2,815 | 3,146 | 3,428 | 3,771 | 4,363 |
Share, demand, pricing, capture, healthcare growth, costs, marketing, discount rate, terminal assumptions and working capital vary jointly. Oil/FX dependence is positive by assumption; share improvement and extra advertising are negatively correlated in the sampled competitive setting, while the structural cost of share regained remains charged separately.
The selected joint distribution produces no values above the quote in 5,000 draws. This does not mean a 0% chance of investment gains: the chosen ranges, correlations and timing are not empirically calibrated, and the separate stretch scenario exceeds the quote. A histogram cannot capture missing products, strategic changes, all macro regimes or investor sentiment.
Scenario assumptions
Triangular ranges are analyst low / central / high judgments
| Driver | Distribution | Low / central / high |
|---|---|---|
| share change | Normal 95% band | -0.05 / 0 / 0.05 |
| income | Triangular | 0.03 / 0.05 / 0.07 |
| income elasticity | Triangular | 0.35 / 0.65 / 0.95 |
| adoption | Triangular | 0 / 0.02 / 0.03 |
| category price | Triangular | 0.01 / 0.02 / 0.04 |
| capture change | Triangular | -0.05 / -0.015 / 0.02 |
| rubs | Triangular | 0 / 0.04 / 0.08 |
| drops | Triangular | 0.02 / 0.07 / 0.12 |
| tablets | Triangular | -0.02 / 0.03 / 0.08 |
| oil | Triangular | -0.2 / 0.1 / 0.4 |
| fx | Triangular | -0.02 / 0.03 / 0.08 |
| mitigation | Triangular | 0 / 0.5 / 0.75 |
| macro floor | Triangular | 0 / 0.25 / 1 |
| extra ad | Triangular | 0 / 0.005 / 0.02 |
| required return | Triangular | 0.095 / 0.117 / 0.135 |
| terminal growth | Triangular | 0.03 / 0.04 / 0.05 |
| terminal roic | Triangular | 0.3 / 0.5 / 0.75 |
| steady nwc | Triangular | -0.1 / -0.07 / 0 |
| mix margin gap | Triangular | -0.05 / 0 / 0.05 |
Fractions are decimal inputs: 0.05=5%; share change 0.05=5 percentage points. The share normal’s ±0.05 endpoints are an approximate 95% interval; triangular endpoints are bounds. Correlations are imposed on normal draws before mapping distributions, so realized Pearson correlations need not equal their latent settings.
Fixed inputs in these trials include the base share-dip timing, population growth, allocation weights and some cost exposures. Their separate sensitivities and the stress scenarios help, but they do not make the simulation exhaustive.
What returns could an investor earn?
Exit multiples can dominate a five-year shareholder outcome
| Case | 20× exit earnings | 30× exit earnings | 40× exit earnings |
|---|---|---|---|
| Base | 2.6% | 10.3% | 16.2% |
| Downside | -4.9% | 2.3% | 7.9% |
| Recovery | 7.7% | 15.7% | 21.9% |
| Optimistic stretch | 11.1% | 19.4% | 25.8% |
Illustrative five-year nominal shareholder IRRs at the INR6,942.50 entry:All modeled free cash flow is hypothetically distributed annually, with the selected exit multiple onY5 after-tax operating profit and the modeled net cash adjustment added at exit. This is a simplified owner-cash cross-check, not the DCF and not a prediction of declared dividends. It excludes shareholder taxes, trading costs and additional excess-cash changes.
The constant-company-growth reverse DCF needs about 13.8% annual sales growth for ten years at the stated base cost structure, capital rules and 11.7% required return to support the current quote. The central five-year sales growth is 6.3%; the higher hurdle should not be confused with management guidance.
A25% research margin-of-safety discount to the lower of central value and the conditional median gives approximately INR2,571/share. This is a conditional review threshold with the business thesis intact, not an automatic buy instruction or a forecast that the market will reach it. Lower value would be warranted if share, cash conversion or affiliate economics deteriorate persistently.
The questions we still need to answer
Monitoring is retained as an additional control
| Research gap | What changed | What is still unverified |
|---|---|---|
| 1. Market denominator and sales bridge | 47% broad value-share proxy;65% disclosed mix; exports separate; capture index explicit. | Current pad-only value/volume share, matched absolute retail sizing. |
| 2. Consumer adoption and income | Income, elasticity, adoption, population and price effects separated; country comparisons. | Causal elasticities, repeat use and affordability thresholds. |
| 3. Competitive execution and recovery cost | Temporary share path; continuing marketing cost for recovery; no duplicate execution deduction. | Distribution productivity, retail inventory, retention and competitor unit economics. |
| 4. Brand/mix profitability and other growth | Rubs, drops, tablets and residual hygiene separated; mix-margin tests. | Whisper/Vicks operating margins and SKU contribution. |
| 5. Macro, price and cost persistence | Explicit raw/traded/FX/freight costs, mitigation, permanence and pricing-demand link. | Actual procurement exposures, hedges and realized price elasticities. |
| 6. Reinvestment, cash and parent economics | Working-capital transition, royalty tests, capex, terminal ROIC, obligations and cash bridge. | Incremental returns, economic benefit of affiliate charges and full dispute outcomes. |
| 7. Valuation and joint uncertainty | Discount/terminal sensitivity;19-driver joint states; reverse expectations and shareholder IRRs. | Calibrated probabilities, future required returns and permanent-loss frequency. |
Monitoring is the eighth control: the next page sets evidence triggers. The gaps are neither all independent nor all measurable from public reports. A precise-looking model cannot replace missing consumer and channel research.
What to watch next
Use comparable evidence to falsify the thesis
| Signal | Why it matters | Reassessment trigger |
|---|---|---|
| Sales and share | Distinguishes category growth from capture. | Two comparable weak quarters while matched category grows; investigate volume and channels. |
| Materials and gross burden | Tests whether cost pressure is temporary. | Cost ratio remains near June 2026 levels without offsetting realization or productivity. |
| Advertising and product returns | Share defense may be more expensive than modeled. | Sustained extra spending without share/volume or repeat-purchase improvement. |
| Cash conversion and supplier terms | Negative working capital can reverse. | Growing receivables/inventory or shrinking payables; recalculate cash needs. |
| Royalties and related parties | Minority owners receive residual economics. | Higher recurring charges or material contract changes; adjust prospective margins. |
| Vicks growth and seasonality | Diversification may not offset pad weakness. | Repeated weakness outside a single weather season; lower product growth inputs. |
| Valuation discipline | A lower price is not sufficient evidence of value. | Re-run the model from fresh filings; compare price with both value and required return. |
Useful management questions: provide a matched volume-price-mix bridge; quantify domestic versus export sanitary revenue; explain ad-spend timing and product payback; disclose how much of material inflation is mitigated; reconcile retail consumption and company shipments.
No channel interviews, consumer surveys or private procurement data were obtained. The report does not infer integrity, staff quality or repeat purchase from audited financial statements alone.
Philip Fisher checklist
Fifteen questions applied to PGHH rather than reduced to a promotional score
These are paraphrased applications of Fisher’s fifteen-point framework in Common Stocks and Uncommon Profits. The judgments below are ours; neither Fisher nor his estate assessed PGHH here. A missing field is not a positive mark. [S17]
| Point | Question | Assessment | PGHH evidence and work required |
|---|---|---|---|
| 1 | Market runway | Mixed | Category evidence supports runway; 2025 value share 47% is only a proxy. Flat company sales require current matched category/share and channel data. |
| 2 | New products and management drive | Supported with limits | Whisper formats and Vicks launches show activity. Incremental profit and cannibalization are not disclosed. |
| 3 | Research effectiveness | Unresolved at listed-company level | Access to parent R&D is valuable, but local zero R&D spending is not proof of zero innovation or of efficient economics. |
| 4 | Sales organization | Partly supported | Broad route to market and strong brands; distributor concentration and sales slowdown require channel checks. |
| 5 | Adequate profit margin | Supported but variable | High reported operating margins; normalization and the weak June quarter argue against freezing the peak. |
| 6 | Sustaining margins | Mixed | Productivity and mix can help; advertising, royalties and material costs must be funded. No full unit-cost bridge is disclosed. |
| 7 | Labor relations | Not independently verified | Formal policies and workforce reporting exist. No independent worker interviews or operational labor-risk assessment. |
| 8 | Executive relations | Not independently verified | Group management systems are visible; internal teamwork and retention quality cannot be inferred from public biographies. |
The principal Fisher tension is between a plausible long runway and weak recent conversion into company sales. Excellent products can coexist with disappointing shareholder returns if competitive spending rises or the entry price assumes too much future growth.
Fisher checklist continued
Scuttlebutt is a research task with measurable questions
| Point | Question | Assessment | PGHH evidence and work required |
|---|---|---|---|
| 9 | Management depth | Partly supported | Global P&G organization offers resources, but succession capability specific to PGHH is not proven by titles. |
| 10 | Cost analysis and accounting controls | Partly supported | Audited financials and internal-control reporting; product/channel profitability is unavailable externally. |
| 11 | Industry-specific strengths | Supported with limits | Trust, habit, retail access and group technology; low switching cost and digital challengers limit pricing freedom. |
| 12 | Long-term profit orientation | Mixed | Consumer programmes and innovations suggest long-term investment; test promotion cuts and high payouts against sustained sales. |
| 13 | Future equity dilution | Low present dependence | Stable share count and cash generation; parent share-based charges remain an economic expense. No future dilution guarantee. |
| 14 | Candor during setbacks | Mixed | The call discusses competition and demand weakness, but brand-level growth/margin bridges are limited. Watch explanations after weak results. |
| 15 | Integrity | No adverse conclusion established; not proven | An unmodified audit is not a character certificate. Related-party terms, disputes and shareholder treatment need continued scrutiny. |
- Interview distributors about fill rates, payment terms, stock aging, scheme intensity and share of shelf across comparable outlets. No interviews are claimed in this report.
- Compare consumer repeat purchase, price per use and product performance across premium and value formats. Separate launch trial from recurring adoption.
- Ask management for brand/category growth, volume-price-mix, innovation cannibalization and margin bridges on a consistent year-over-year basis.
- Check supplier and employee perspectives on operating reliability, innovation execution and decision speed. Public policy documents alone do not answer those questions.
Munger Buffett Marks and Klarman
Four additional lenses challenge the same investment decision
| Lens | Application to PGHH | Consequence for the model |
|---|---|---|
| Munger: incentives and inversion | Parent owns brand/capability relationships and benefits from royalties and dividends. Ask how a minority owner could lose despite strong brands. | Map affiliate economics, float reversal, tax disputes, competition and overpayment. No automatic governance discount is invented. |
| Munger: opportunity cost and multiple causes | A falling price, high ROE and a new product can jointly create a persuasive story while growth remains weak. | Do not count three descriptions of the same demand driver as separate revenue uplifts. Compare cash return with the required return. |
| Buffett: owner economics and moat | Look at cash after necessary marketing, maintenance and reinvestment; distribution and trust are advantages, switching costs are limited. | Use normalized owner cash, remove non-operating income from operating value and avoid paying solely for a brand label. |
| Buffett: capital allocation and understanding | Large payouts are useful only after business needs are met; related-party contracts and brand rights shape minority cash flows. | One-entity DCF, no guessed brand sum-of-parts, explicit obligations and share count. |
| Howard Marks: price versus quality and uncertainty | Risk includes paying for recovery that never arrives. A familiar product does not eliminate permanent-loss risk. | Separate scenarios, tail stress and sample frequencies. No single-point certainty or promise that price converges quickly. |
| Seth Klarman: downside and catalyst | A margin of safety should survive ordinary disappointment. A delisting catalyst is contradicted by the company clarification. | Use a 25% valuation discount only with the thesis intact; retain cash as an alternative to forced buying; no speculative premium. |
These are analyst adaptations of published frameworks, not a mechanical vote by five investors and not a claim that any of them would buy or sell PGHH. The combined conclusion is that product quality deserves attention, but the price must leave room for disappointing growth, ongoing investment and uncertainty. [S16–S20]
Our view could be too conservative if PGHH compounds sales much faster than the recent record, retains high supplier funding and premium margins, and investors reasonably require a lower return. It could still be too optimistic if competitive erosion, affiliate terms, inflation or legal outcomes permanently reduce owner cash. Those alternatives are explicit in the recovery, stretch and downside cases.
Two reviews and the change log
Evidence audit followed by independent arithmetic implementation
| Review | Checks and corrections |
|---|---|
| Review 1: evidence and assumptions | Rechecked statutory operating revenue versus press-release wording; corrected nine-month annual comparisons; separated 47% broad value share from unverified 44%; replaced guessed pad mix with 65% BRSR disclosure; removed overlapping execution deductions. |
| Review 2: arithmetic and contradiction | Python model and separately written workbook formulas agree in all four cases. Tested a share-input change and missing-input error propagation. Reconciled costs, PAT bridge, capital and terminal cash flow. Challenged the conclusion with a recovery case, lower discounting and the optimistic stretch. |
| Presentation / reproducibility | Report tables and charts use the same saved JSON results. Rendered pages and workbook views are inspected. Sources, scripts, trials and checks remain in the research folder. |
| Limits | Two reviews are two documented analytical passes, not two independent human opinions or an assurance of unbiased truth. No native Excel desktop test or benchmark-adjusted price-event study is claimed. |
Version 2 central value INR3,125.53 → removing only the old execution drags in that model INR3,304.20 → complete v 3 rebuild INR3,441.16. The remaining difference reflects the combined mix, capture, expense and capital changes; it is not a single isolated effect.
The strongest challenge to our cautious conclusion is a long period of faster category expansion plus durable share gains, good cost control and a lower required return. The strongest challenge to our recovery assumption is ongoing sales stagnation despite investment, persistent material pressure and worsening minority-owner economics.
12 October editorial review: simplified the introduction and added sourced company history and dated share-price comparisons. Numerical validation from version3 is retained; no new unbiased-estimate or independent-human-review claim is made.
Report-specific disclosures and research boundaries
Dated 13 October 2026 | PGHH | Free research
Publication edition, version 3.3, dated 13 October 2026. Aditya Siddharth Mehta has approved this report and its analytical views and retains responsibility for the published research. The 11 October version 3 model, forecasts, scenarios and simulation outputs are unchanged. The workbook remains the original version 3 model; fixed snapshots must be regenerated after editing inputs.
Holdings and financial interests: On 13 October 2026, Aditya Siddharth Mehta confirmed no PGHH shares or other financial interests. He confirmed that the ownership declaration covers himself and applicable associates/relatives, to his knowledge, as at 30 September 2026; no ownership of 1% or more is declared for that scope and date. These are knowledge-qualified analyst declarations, not an independent audit of holdings.
Compensation, relationships and other disclosures: The analyst confirmed no compensation from PGHH during the preceding 12 months, and no other material conflicts, relevant business or service relationships, issuer employment/directorship, offering or market-making roles, or personal-trading/disciplinary issues to disclose. Report charge: free. These statements reflect the analyst’s confirmation; no independent account or regulatory audit is claimed.
Analyst identity: Aditya Siddharth Mehta, individual SEBI-registered Research Analyst, registration INH000029768. The official SEBI directory record dated 12 October 2026 confirms validity from 20 August 2026 to perpetual. BSE’s public enlisted-analyst directory confirms enlistment 7462 for the same registration and name; checked 13 October 2026.
AI assisted extraction, analysis, modeling, writing and presentation. No independent human audit is claimed. Company transcripts are edited company versions; the user’s YouTube call was used through the corresponding published transcript, without an independent audio-to-text audit. Reported management explanations and analyst inferences are distinguished.
Research boundaries and investor information
Read with the dated report-specific declarations
The archive includes 20 annual reports,76 quarterly-result PDFs and all four linked 2023–2026 call transcripts. This does not mean every page was independently audited. Current work examines 2016–2026 financial history,13 quarters and the listed evidence sources. Historical daily-price downloads failed; the alternative price sources and their limits are disclosed.
Valuations and returns are conditional research outputs, not personal financial advice or assurances. Model inputs can change materially. Generalized investor frameworks do not imply an endorsement by Fisher, Munger, Buffett, Marks or Klarman.
The workbook recalculates the selected live case. Saved scenario comparisons, sensitivities, simulations and this report must be regenerated after input edits. The source manifest, raw evidence, code, results and QA record are the durable handoff.
General research, not personalized investment advice or an assurance of returns. Valuation outputs depend on assumptions. Brokerage, statutory charges and investor taxes are separate from the free report charge. Past performance is not an indicator of future performance.
Contact and grievances: +91 7021135925; adi2001me@gmail.com. Address: Aditya Villa, Daksha Niwas, S.T. Road, Chembur, Mumbai, Maharashtra 400071. Disclosures; Investor Charter; Grievance Redressal; SEBI SCORES.
Investment in securities market are subject to market risks. Read all the related documents carefully before investing. Registration granted by SEBI, enlistment with BSE and certification from NISM in no way guarantee performance of the intermediary or provide any assurance of returns to investors.
Latest update and version history
13 October 2026 publication · 12 October 2026 editorial revision
Version 3.3 publishes the approved report with the opening valuation cockpit, downloads and report-specific disclosures confirmed by the analyst on 13 October 2026. No new valuation, quote refresh or change to model assumptions is made.
Version 3.2 adds the approved comeback headline, opening valuation cockpit, four-scenario comparison and dated analyst declarations. Version 3.1 added the plain-language business introduction, company history and recent share-price discussion. Both retain the 11 October version 3 valuation model and its stated limitations. No new independent audit or model recalibration is claimed.
Updates are made when substantive evidence is reviewed. Continuous monitoring is not promised. Read the source dates before using any carried-forward estimate.
Sources and reproducibility
Primary filings control financial amounts; estimates are labeled
S1 — FY2026 annual report. P&L PDF p 93; cash flow pp 94–95; cash/share count p 119; expense notes pp 127–128; contingent claims pp 150–151 Open source.
S2 — June 2026 quarter. PDF p 3; quarter and June 2025 comparative Open source.
S3 — June 2024 result. PDF p 1; reconstruct comparable Apr 2024–Mar 2025 Open source.
S4 — FY2024 annual report. FY2023–2024 statutory statements Open source.
S5 — FY2022 annual report. FY2021–2022 statutory statements Open source.
S6 — FY2020 annual report. FY2019–2020 statutory statements Open source.
S7 — 16 June 2026 analyst transcript. Company edited call transcript; original YouTube call supplied by user Open source.
S8 — 12 June 2025 analyst transcript. Management claims and Q&A Open source.
S9 — 18 September 2024 analyst transcript. Management claims and Q&A Open source.
S10 — 22 September 2023 analyst transcript. Management claims and Q&A Open source.
Sources and reproducibility continued
Primary filings control financial amounts; estimates are labeled
S11 — NSE official 9 October 2026 bhavcopy. PGHH EQ close 6942.50, not last trade 6944.50 Open source.
S12 — NSE official 9 September 2026 bhavcopy. PGHH EQ close 7615.00 Open source.
S13 — NSE official 9 October 2025 bhavcopy. PGHH EQ close 14194.00 Open source.
S14 — Company rumour clarification 23 September 2026. Denies delisting and winding-up rumours Open source.
S15 — Reuters via Economic Times 9 October 2026. Secondary source; 6.94% 2036 benchmark yield 7.2994%; no direct RBI yield verification Open source.
S16 — Warren Buffett Berkshire owner manual. Intrinsic-value and owner-oriented framework; our PGHH application Open source.
S17 — Philip Fisher Common Stocks and Uncommon Profits Wiley. Fifteen-point checklist paraphrased; no endorsement or claim of original research Open source.
S18 — Poor Charlies Almanack authorized edition. Munger mental-model framework; our PGHH application Open source.
S19 — Howard Marks Risk Revisited Again. Risk/uncertainty framing; not a calibrated loss probability Open source.
S20 — Baupost investment philosophy. Valuation, downside, catalysts and willingness to hold cash Open source.
S21 — Company Anatomy ITC reference. Structure and design reference; saved reader edition used when web fetch failed Open source.
S22 — PGHH investor archive. Archive of reports/calls; all downloads indexed separately Open source.
Sources and reproducibility continued
Primary filings control financial amounts; estimates are labeled
S23 — Euromonitor menstrual care in India. Public 2025 summary: category growth and retail value share; archived text. Open source.
S24 — World Bank and country category comparison. 2024 PPP income; country category pages and raw API responses archived in Driver_Revision/evidence. Open source.
S25 — NFHS-5 national report. Menstrual methods among ages 15–24; multiple methods possible. Open source.
S26 — Correct July 29 June-quarter press release. Management narrative; total-income versus revenue wording noted. Open source.
S27 — FY2018 annual report. Investment/GST context and statutory figures. Open source.
S28 — FY2017 annual report. Restated 2016–2017 comparatives; monthly NSE price ranges. Open source.
S29 — Calendar price/dividend history. Secondary closed-calendar-year data; current quote uses officialNSE instead. Open source.
S30 — Euromonitor Indonesia menstrual care May 2026. Public publisher summary; domestic-currency sales and volume distinguished. Open source.
S31 — Euromonitor Japan menstrual care May 2026. Public publisher summary; maturity/population comparison. Open source.
S32 — Euromonitor China menstrual care May 2026. Public publisher summary; maturity and competitive dynamics comparison. Open source.
Local reproduction files: model_v3.py, history.py, build_workbook.mjs, report_revision_v3.py and build_report.py; results.json, history.json and joint_simulation.csv; qa/ contains model/workbook checks and rendered views. Annual/call URLs and the original source manifest remain in PGHH/.
Sources for the new introductory sections
Company history and the latest indicative price
S33: Nirmal Bang initiation,22 June2023. Secondary historical chronology; Whisper launch dated1989. No historical share estimate from this source is carried into the current model. Open source.
S34: Contemporary1999 portfolio strategy coverage. Secondary report dated21 September1999; supports the focus on hygiene and healthcare, not a precise legal rename date. Open source.
S35: Upstox PGHH price page. Displayed12 October2026,15:29IST:6976.50, versus prior close6942.50. Indicative secondary quotation; not an official close. Open source.
The company annual report confirms incorporation in1964 and acquisition by P&G in1985. Archived NSE files support the9 September2026,9 October2025 and9 October2026 closing prices. Existing source numbering is preserved throughout this edition.
Downloads and version notes
Report version 3.3 · Original valuation model version 3
The PDF reproduces this publication edition. The Excel workbook is the original 11 October 2026 version 3 valuation model. Editable selected-case formulas and saved sensitivity/simulation snapshots have different recalculation behavior; consult its instructions before changing assumptions.
Download PDF report — publication edition v3.3
Download Excel valuation model — original v3, 11 October 2026