
Research cockpit
ITC: price discipline comes first
Conditional recovery case · Research horizon: 3–5 years
The safety-first conclusion
These are decision bands if the recovery assumptions hold, not automatic buy or sell orders.
Why ₹269? It is approximately 20% below the lower-quartile value of ₹336. ₹370 is the median and ₹413 the upper quartile. These thresholds change when assumptions change. Read the full price-band logic and assumption charts.
Not a 99.5% chance of making money. Model frequencies describe assumed business values, not future stock prices or investment success. Consult a SEBI-registered investment adviser about suitability, diversification and position size. Analyst holds ITC shares; relatives may also hold shares. Read disclosures.
ITC logo sourced from ITC’s official website, used for identification. ITC owns its mark. No affiliation or endorsement is implied.
Meet ITC: familiar brands, concentrated profits
ITC Limited is a diversified Indian company. It sells cigarettes and everyday consumer goods, sources and trades agricultural products, makes paperboards and packaging, and provides IT services through ITC Infotech. Familiar consumer brands include Aashirvaad, Sunfeast, Bingo!, YiPPee!, Classmate and Savlon. Company business overview; FY2026 annual report.
The important distinction is between sales and profits. In FY2026, cigarettes supplied roughly 40% of external net product sales but about 79% of segment EBITDA before corporate costs and eliminations. Consumer brands provide growth opportunities, yet the cigarette franchise still drives much of the valuation. Following the hotel demerger, ITC Hotels is an associate investment, not the old consolidated hotel operating segment. See the business and accounting bridge.
Recent share performance: a rebound within a weaker month
The latest available pre-market comparison is ₹266.20 for 17 September 2026. The published price-history series shows a 0.78% rise from ₹264.15 on 16 September, but a 2.51% decline from ₹273.05 on 17 August. It is 5.27% below ₹281.00 on 31 July. These are point-to-point price changes, not dividend-inclusive total returns, and are not evidence that the stock must rebound. Price-history source, checked 18 September 2026.
Our question is therefore not simply “has the share fallen?” It is whether the cash ITC can generate under reasonable recovery assumptions justifies the price paid. The cockpit summarises the answer; the sections below expose what must go right and what could go wrong.
How to read the ranges before acting
Think of each simulation as one internally calculated “what if” business path. We draw economic growth, cigarette recovery, margins and required return from stated ranges, calculate ten years of cash flow, then discount that cash into a value per share. The same 5,000 saved paths power the tables and charts. No inputs were changed for this reader update.
| Term | Plain-language meaning |
|---|---|
| Assumption range | The limits chosen for an input. A bounded model cannot reveal outcomes it was not allowed to sample. |
| Valuation range | The middle 90% of the model’s values is about ₹296–₹486. This is not a 90% confidence interval for the future market price. |
| Model frequency | At ₹266.20, 99.52% of draws value ITC above that quote, while 77.12% leave a 20% margin of safety. This is a count inside the chosen model, not an observed success rate. |
| Margin of safety | A 20% cushion means paying no more than 80% of estimated value. It can absorb some forecast error, but does not prevent a loss. |
What must hold: the main simulation assumes FMCG reaches ₹50,000 crore by FY2031, cigarette volumes regain the prior-year run-rate in the second half of FY2027, and no extra near-term tobacco-tax shock. It also fixes working-capital days, terminal growth and terminal returns. Those conditions are not “proven” by 5,000 runs. If they fail, revalue the business rather than reuse the old add/reduce bands.
Lower entry prices offer more room for error; higher entry prices require more favourable outcomes. That is the reason for the staged-add and reduce framework. A falling share price is not itself confirmation of value, and a rising share price is not proof that the assumptions improved. The separate ₹206 stress combines weaker operating assumptions with a higher required return. It has no assigned probability.
Download and audit: Original release report (PDF, 18 September) · 5,000-scenario Excel companion · Dated operating-formula source workbook
COMPANY ANATOMY
Equity research • ITC Limited • Research report
The answer in one minute
Financial interest: the analyst holds ITC shares as a long-term investment; relatives may also hold shares. Read the dated disclosures before using this report.
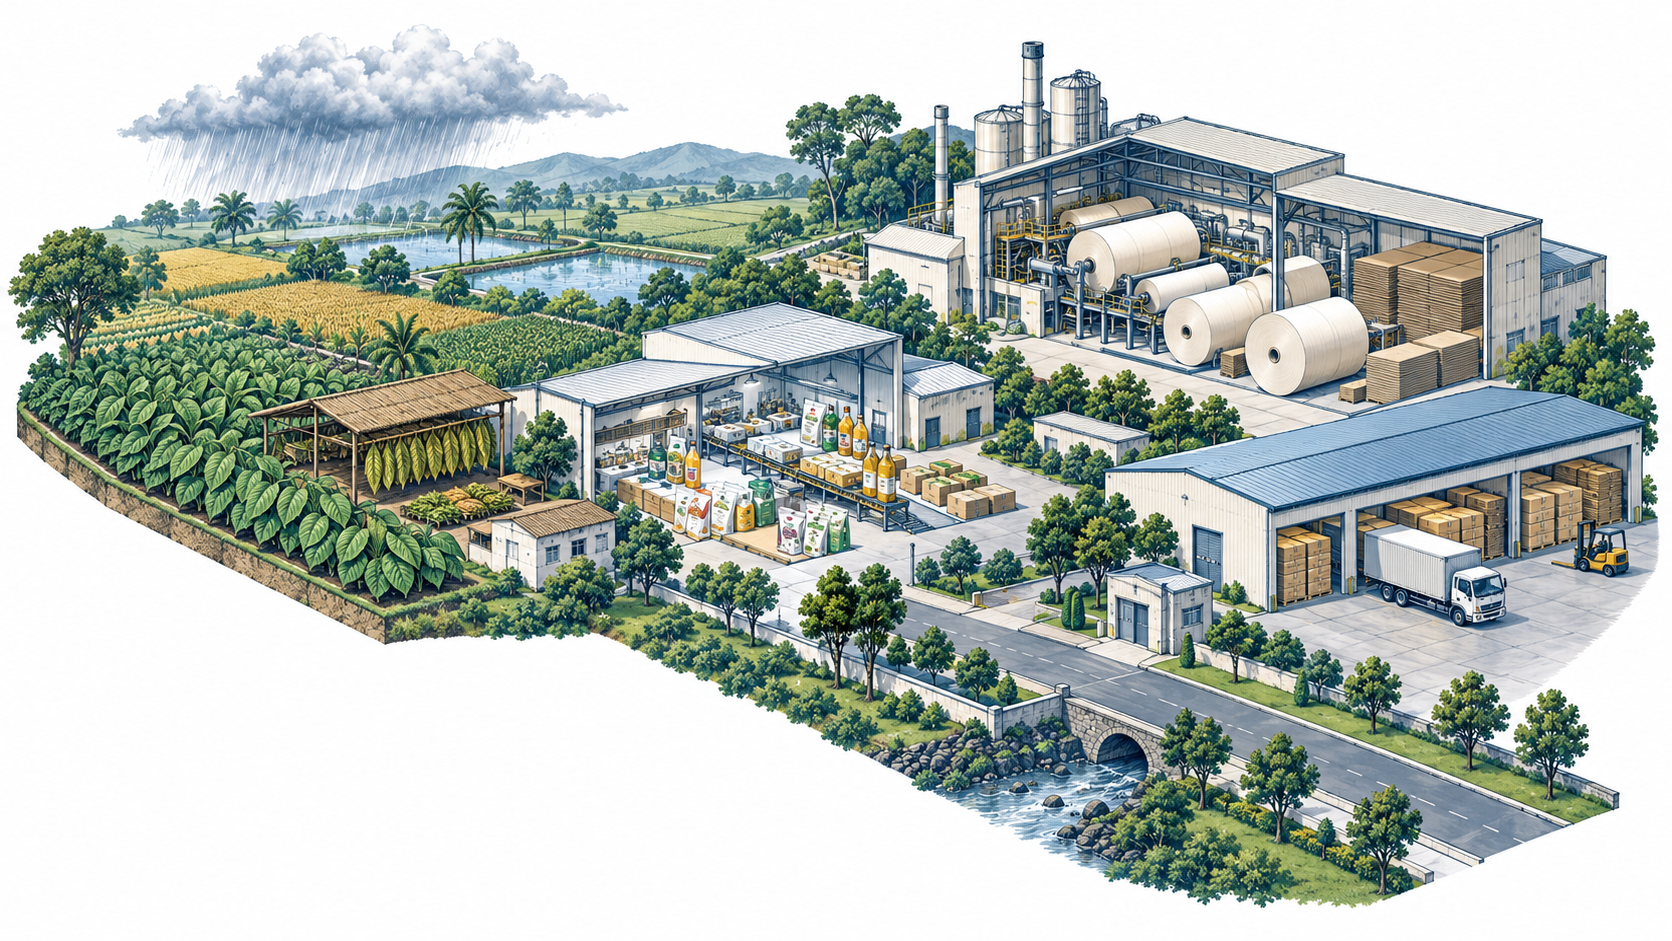
At the verified publisher quote of ₹266.20, ITC looks inexpensive if cigarette earnings recover and FMCG delivers the assumed growth. The indicative central value is ₹382; the 5,000-run median is ₹370. That is a valuation case, not a promise that the market will agree.
When to add, hold or reduce
A margin of safety is the discount you demand to an estimated value. If you estimate a business at ₹100 and pay ₹80, the margin is 20%. It is a cushion against mistakes, not insurance against loss.
| Share price | General research stance | Reason |
|---|---|---|
| Up to ₹237 | Strongest model cushion; consider small staged additions | 20% below the lower-tail P5 value. Still not a guaranteed floor. |
| ₹237 to ₹269 | Staged add candidate if the thesis is intact | 20% below lower-quartile value at the top of this band. |
| ₹269 to ₹296 | Selective additions after operating evidence | Still 20% below median at the upper boundary, but less downside cushion. |
| ₹296 to ₹370 | Hold / monitor; avoid automatically averaging up | Less than 20% safety margin to the median. |
| ₹370 to ₹413 | Review position size; consider trimming | Above the median. Increasing dependence on better outcomes. |
| Above ₹413 | Consider reducing / avoid fresh additions without stronger evidence | Upper-quartile territory; above ₹486, fewer than 5% of model values are higher. |
At ₹266.20, the quote is in the staged-add band and 28.1% below the median. Yet the combined downside of ₹206 is 22.7% below the quote. Price alone is insufficient.
When: review after each quarterly result, any tobacco-tax change, material acquisition or capital-allocation announcement. Add only if retained realization, volume recovery and cash conversion support the forecast. If evidence weakens, reduce the valuation first; do not average down simply because the price fell.
How entry price changes the model’s odds
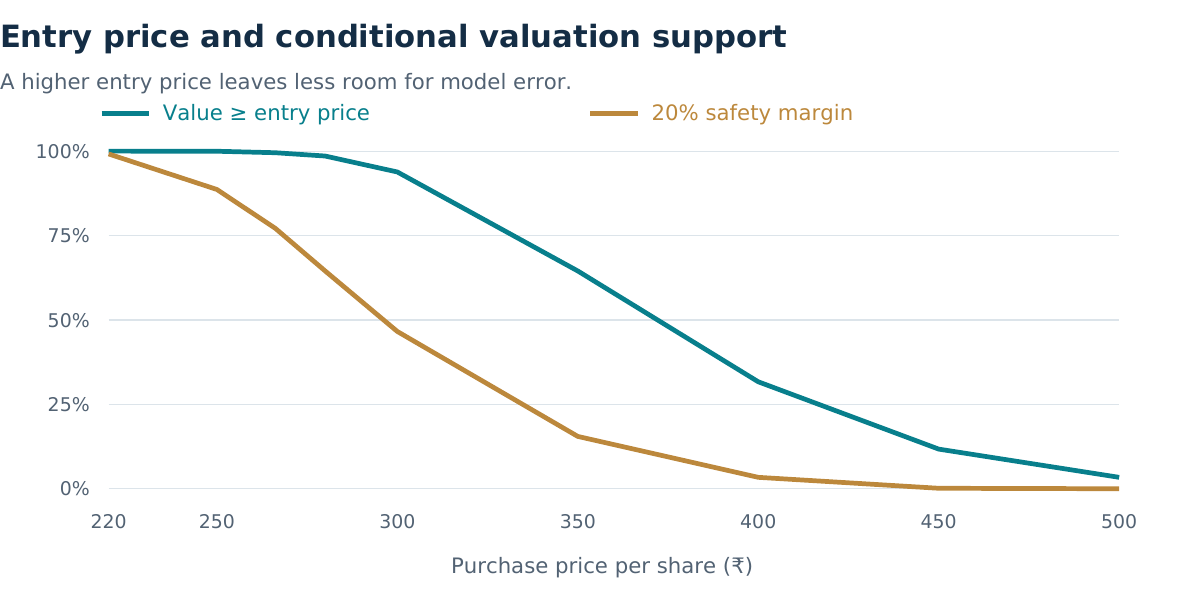
| Entry price | Value ≥ price | 20% safety margin | Discount to median |
|---|---|---|---|
| ₹220.00 | 100.00% | 99.16% | 40.5% |
| ₹250.00 | 99.96% | 88.64% | 32.4% |
| ₹266.20 | 99.52% | 77.12% | 28.1% |
| ₹280.00 | 98.54% | 64.50% | 24.3% |
| ₹300.00 | 93.82% | 46.58% | 18.9% |
| ₹350.00 | 64.50% | 15.50% | 5.4% |
| ₹400.00 | 31.68% | 3.38% | -8.1% |
| ₹450.00 | 11.74% | 0.14% | -21.6% |
| ₹500.00 | 3.38% | 0.00% | -35.1% |
5,000 scenarios, not 5,000 promises
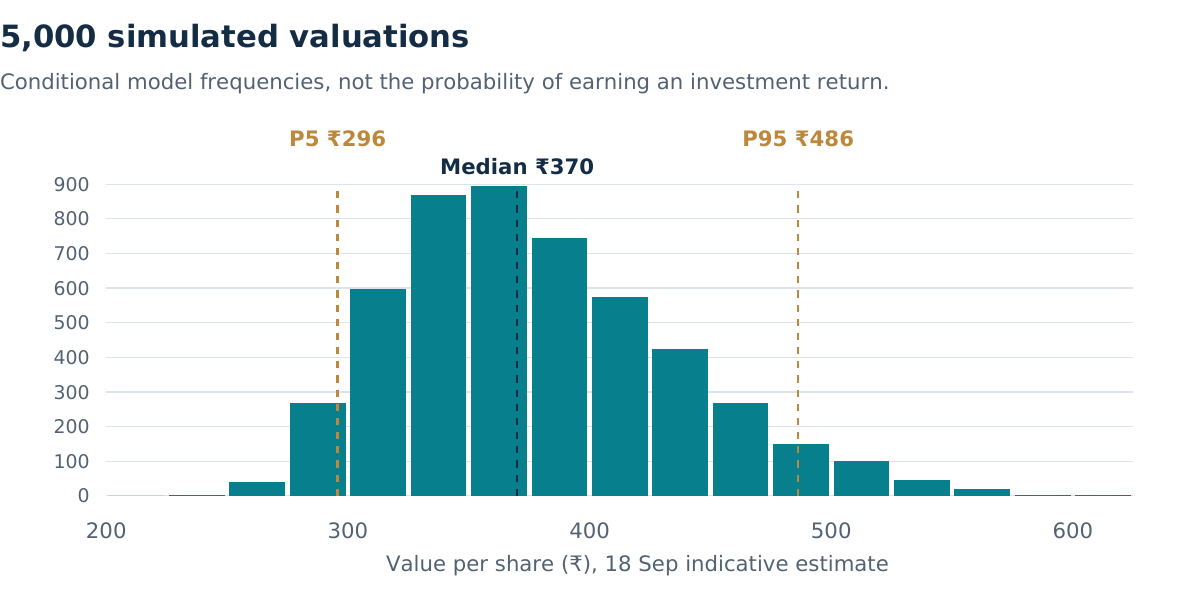
| Statistic | 31 Mar base | 18 Sep estimate |
|---|---|---|
| P5 | 291.87 | 295.76 |
| P25 | 331.02 | 335.79 |
| Median | 364.61 | 370.06 |
| P75 | 407.35 | 413.43 |
| P95 | 478.39 | 486.33 |
| Mean | 372.19 | 377.73 |
| Number of trials | 5,000 | 5,000 |
The middle half of the September outcomes is ₹336-₹413; the central 90% spans ₹296-₹486. The model fixes FMCG target achievement, mid-FY27 cigarette volume run-rate recovery and no additional near-term tobacco tax shock.
Where the economics come from
ITC combines high-profit cigarette operations with growing consumer brands, agricultural sourcing and trading, paper and packaging, and services. Consolidated cigarette results include Surya Nepal. “Others” includes ITC Infotech, the retained Grand Central hotel and fresh food. Demerged ITC Hotels is an associate, not the former consolidated hotel operating segment. [S1]
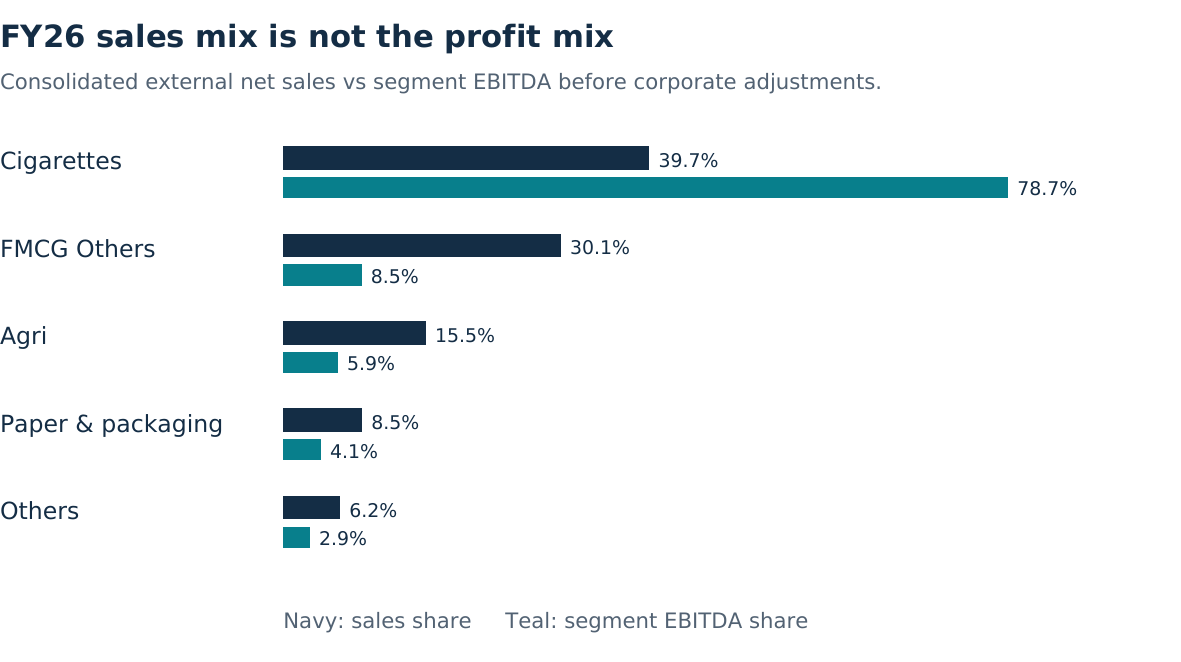
| Business | External net sales | Segment EBITDA | Margin basis |
|---|---|---|---|
| Cigarettes | 32,080.64 | 22,539.17 | 70.3% of net sales |
| FMCG Others | 24,314.95 | 2,431.67 | 10.0% incl. internal sales |
| Agri | 12,486.13 | 1,690.45 | 8.1% incl. internal sales |
| Paper & packaging | 6,889.90 | 1,160.62 | 13.2% incl. internal sales |
| Others | 4,966.23 | 821.95 | 16.3% incl. internal sales |
Diversification is a revenue fact, but cigarette economics still dominate segment profit. Faster growth in a lower-margin business can dilute the group margin even when each business improves. Tobacco taxation, illicit substitution and public-health regulation therefore remain central risks, not footnotes.
India’s FMCG opportunity: large, but not all ITC’s
FMCG means everyday packaged consumer goods: food, personal care and household products. A growing market helps, but ITC still has to win shelf space, repeat purchases and profitable market share.
| Measure | Reported size | What it does and does not say |
|---|---|---|
| India’s broad FMCG market, 2025 | US$288 billion | IBEF industry estimate, not an audited census or ITC’s addressable sales. [S20] |
| ITC FMCG annual consumer spending | Over ₹37,000 crore | Retail spending on its brands, including value captured outside ITC; not consolidated company revenue. [S1] |
| ITC FY26 FMCG external net revenue | ₹24,314.95 crore | The consolidated revenue denominator used in our model. [S1] [S10] |
| ITC-addressable market in 2035 | Around ₹8 lakh crore | Management estimate of future category opportunity, not ITC sales guidance. [S7] |
Do not divide the ₹24,315 crore revenue number by the dollar market estimate and call the answer ITC’s market share. Currency, calendar year, geography, category coverage and retail-versus-company-sales definitions differ. Neither the industry estimate nor the 2035 opportunity is independently used as a growth multiplier.
| FY31 revenue assumption | Five-year growth needed from FY26 | Indicative ITC value |
|---|---|---|
| ₹50,000 crore | 15.5% annually | ₹382 |
| ₹40,000 crore | 10.5% annually | ₹365 |
| ₹35,000 crore | 7.6% annually | ₹357 |
₹50,000 crore is a reported medium-term aspiration; FY31 is our assumed deadline. Achieving it is already built into every main simulation. The lower-target rows are separate tests with other central assumptions unchanged, not assigned probabilities. [S8] [S32]
Higher income does not mechanically mean more smoking
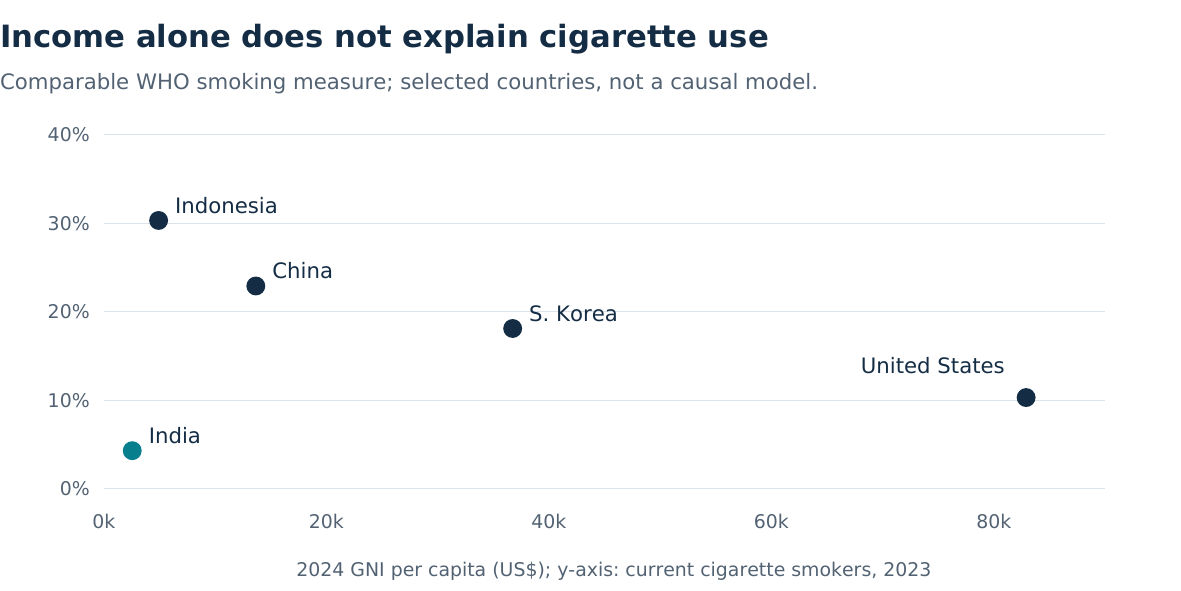
| Country | GNI/person US$ | Cigarette smokers | Affordability cost |
|---|---|---|---|
| India | 2,550 | 4.3% | 8.43% |
| Indonesia | 4,920 | 30.3% | 5.01% |
| China | 13,660 | 22.9% | 1.93% |
| South Korea | 36,750 | 18.1% | 0.92% |
| United States | 82,910 | 10.3% | 1.03% |
India’s low cigarette prevalence is not empty demand waiting to be filled: bidis and smokeless tobacco, health awareness, affordability, gender differences and regulation matter. Income growth can support premium products, but country comparisons do not prove causality or a future conversion rate to cigarettes. No five-country correlation is used to calibrate ITC growth.
Tax shocks: recovery is possible, full recovery is not automatic
| Episode | Observed outcome | What it means for ITC |
|---|---|---|
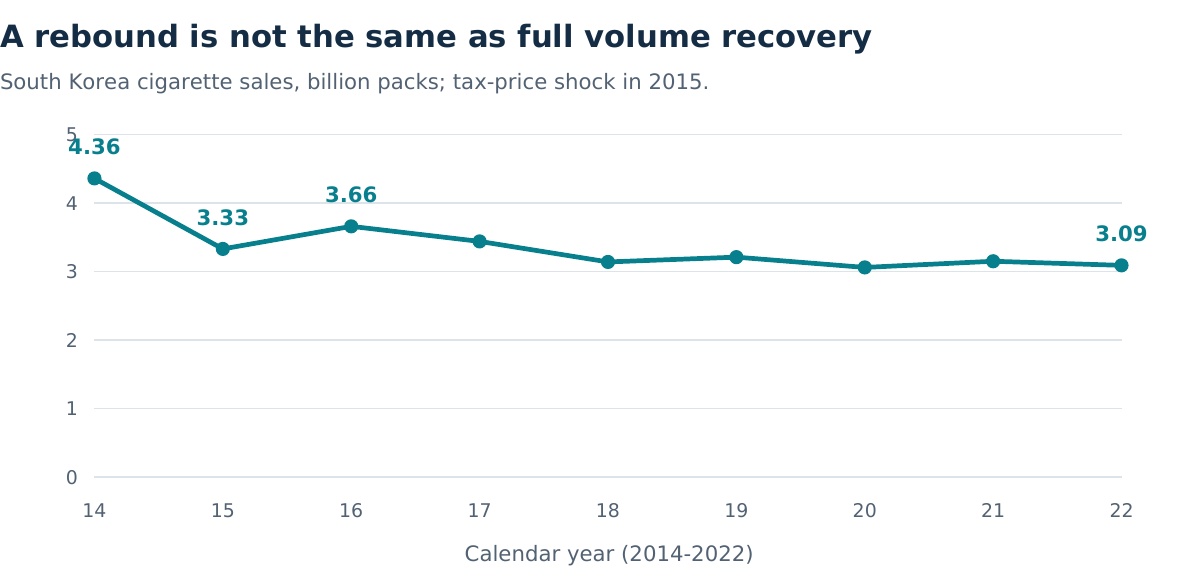
| South Korea, 2015 | 2015 sales -23.7%; 2016 +9.9%, still 16.1% below 2014 | A rebound from a depressed base is not full recovery. |
| China, 2015 reform | Prices about +10%; sales -3.3% over Apr15-Mar16 | Pass-through can reduce consumption; government tax revenue is not producer profit. [S30] |
| Philippines, 2012 onward | Tobacco-smoking prevalence 28.2% (2009), 22.7% (2015), 18.5% (2021) | A long policy sequence, not an isolated experiment proving a single tax effect. [S31] |
| India, 2014-15 | ITC described repeated excise hikes and pressure on legal industry volumes | Company commentary supports downside mechanisms but not a quantified probability of mid-FY27 recovery. [S34] |
Can ITC keep raising cigarette prices?
There are three prices to distinguish: what the smoker pays, what ITC retains after taxes and trade margins, and what the investor pays for the share. A tax hike may lift the first, reduce the second and hurt the third.
| Annual growth parameter | Share of 5,000 draws | Interpretation |
|---|---|---|
| Below 4% | 20.6% | Lower pricing-power states |
| 4% to below 6% | 67.9% | Middle pricing states |
| 6% to 7% | 11.5% | Stronger pricing states |
| At least 5% | 45.0% | Overlapping threshold, not an additional bucket |
Distribution: beta-PERT minimum 2%, most-likely 5%, maximum 7%; selected once per trial, then growth fades later. Positive pricing occurs in 100% of these draws because negative growth was excluded by assumption. These are not empirical probabilities that ITC will deliver such pricing. The 85% retained-price recovery assumption is a separate catch-up, not another ordinary annual price rise. [S32]
| Retail-price rise | Volume at elasticity -0.3 | At -0.5 | At -0.8 |
|---|---|---|---|
| 10% | -2.8% | -4.7% | -7.3% |
| 20% | -5.3% | -8.7% | -13.6% |
| 30% | -7.6% | -12.3% | -18.9% |
Calculated as (1+price change)^elasticity – 1, holding income and other factors fixed. WHO’s broad evidence often puts consumption loss near 4-5% for a 10% price rise. Our wider sensitivity is judgment, not an ITC-specific estimate. Do not apply retail-price elasticities directly to a net-of-tax revenue shock. [S33]
Model consequence: keep the main simulation conditional, but test normal retained pricing of only 2%, no catch-up and weaker volume together. A real probability of pricing success would require consistent ITC volume/realization data, tax-adjusted prices and a fitted, out-of-sample tested demand model. Public cross-country averages are insufficient.
History informs recovery; it does not guarantee it
| FY | Net revenue ₹cr | Cigarette margin | FMCG margin | Paper margin |
|---|---|---|---|---|
| 2022 | 60,715 | 74.1% | 9.2% | 27.6% |
| 2023 | 71,128 | 74.1% | 10.3% | 29.1% |
| 2024 | 67,840 | 73.7% | 11.2% | 20.8% |
| 2025 | 75,308 | 72.3% | 9.9% | 15.2% |
| 2026 | 81,393 | 70.3% | 10.0% | 13.2% |
| Bridge item | Amount |
|---|---|
| Sum of segment EBITDA | 28,643.86 |
| Profit eliminations | (37.56) |
| Corporate expenses net of unallocated income | (1,282.44) |
| Unallocated D&A add-back | 132.81 |
| Model operating EBITDA | 27,456.67 |
| Net revenue from operations | 81,392.97 |
| Comparable model margin | 33.73% |
The denominator matters. Cigarette gross revenue includes ₹8,520.36 crore of revenue taxes; the model removes them to derive net sales. Agri and paper profits include internal trading, which must be considered when applying segment margins but eliminated from consolidated sales. This correction removes the earlier denominator mismatch. [S1]
Management: implementation is stronger evidence than aspiration
| Business | Evidence of progress | Counter-evidence / model consequence |
|---|---|---|
| Cigarettes | FY22-FY23 management described availability improvements and legal-market recapture. | Reopening, enforcement and taxes also changed. Recovery growth is not a permanent volume-growth rate. [S4] [S5] |
| FMCG | Brand scaling and distribution supported margin improvement into FY24. | Margin fell back toward 10% in FY25-FY26. A 16% endpoint requires execution, not merely sales growth. [S1] [S2] [S3] |
| Paper | Integrated sourcing and value-added products are strategic strengths. | The FY23 margin peak was not sustained. Imports, realizations and wood costs remain cyclical. [S1] [S4] |
| Agri | Value-added products and sourcing reach expand opportunities. | Export restrictions and commodity-price swings can overwhelm a simple GDP link. [S1] [S2] |
| IT services / new businesses | Digital capabilities, partnerships and acquisitions widen the opportunity set. | Revenue growth and acquired scale need not improve cash returns immediately. No separate AI/platform “option value” is added. [S1] [S2] |
Q1 FY27: management describes staggered cigarette pricing and product interventions, with consolidated FMCG revenue up 15% and group EBITDA down 24% year on year. These observations support adaptation, but neither proves a quantified cigarette recovery schedule. [S6]
The ₹50,000 crore FMCG topline aspiration was reported as medium-term. FY2031 is our model convention, not a verified deadline. It is company revenue, not consumer spending or the addressable market. The distinction materially affects forecast credibility. [S8]
The chairman’s ₹20,000 crore medium-term capex plan is treated as a five-year floor in the model. That timing is an analytical choice, not precise annual guidance. [S7]
Research notebook: what we learned and changed
This is an edited, public-facing digest of the dated research record, not a verbatim internal working log. It records evidence, corrections, decisions and unresolved tests. Earlier checkpoints are superseded where identified; their figures must not be combined with the current valuation. The underlying annual-report references remain available in Sources.
| Lesson | Finding from the research | Practical consequence |
|---|---|---|
| Accounting basis first | The early 26.6% FY2031 diagnostic used external revenue for margins whose profits included internal trading. Correcting that denominator alone raised the diagnostic to about 27.6%, not 35%. | Use total segment revenue to estimate segment profit, then remove internal turnover and consolidation adjustments from the group. Audited bridge. |
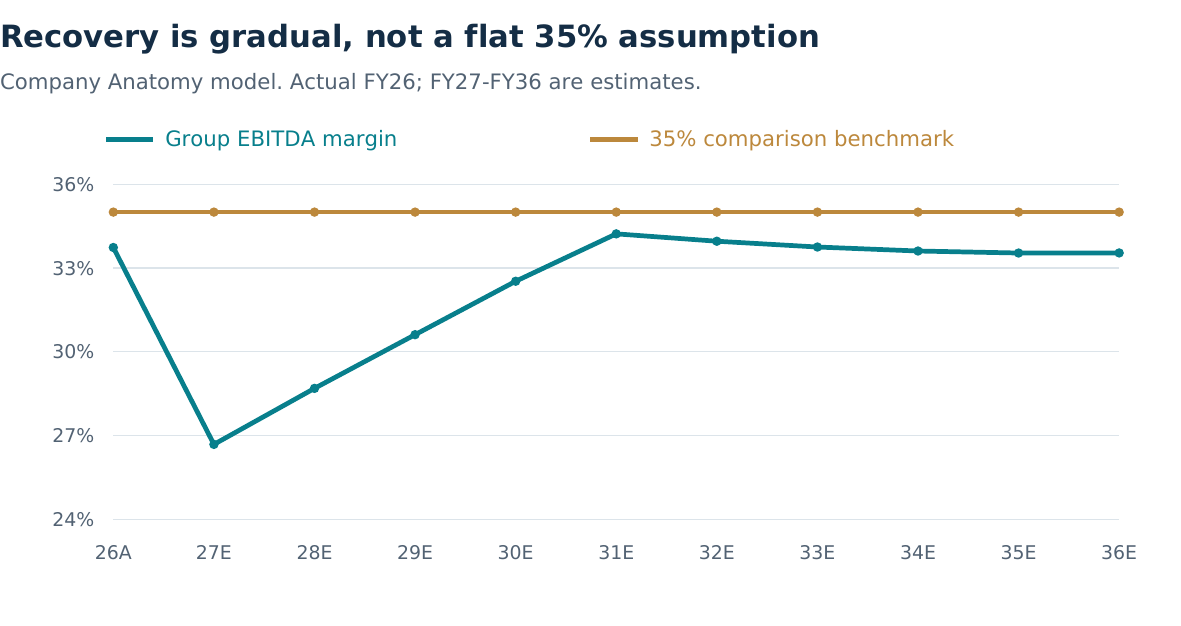
| One coherent margin path | The revised DCF and EPS use the same segment-derived profits. Central group margin is 26.69% in FY2027, 34.22% in FY2031 and 33.54% in FY2036. | Do not force a historical group margin despite a changing business mix. Lower-margin FMCG can dilute the group even while growing profitably. |
| A tax event is not an earnings add-back | A one-time tax-rate increase can create a lasting loss of retained realization or volume. Volume recovery and price recovery are different. | Keep initial shock, normal pricing, volume growth and catch-up separate. The 85% recovery mode is judgment, not management guidance. |
| Historical EPS is a cross-check, not a target | Long-run EPS comparisons cross pandemic recovery and the hotel demerger. Reported demerger gains are not recurring cash earnings. | Do not tune DCF to a historical CAGR, a broker target or the market quote. Graham’s separate EPS heuristic cannot replace the cash-flow model. |
| Targets are not outcomes | ₹50,000 crore is a reported medium-term FMCG aspiration. FY2031 is our assumed delivery date. Retail consumer spending and addressable-market size are different metrics. | Track organic versus acquired sales and profit. All main trials assume target achievement; lower-target stress tests are essential. Target audit. |
| Operating leverage must be paid for | Recovered margins imply cigarette variable unit-cost normalization, including a roughly 5.7% decline in FY2031 in the central path. The fixed/variable split is not audited disclosure. | Monitor leaf cost, retained price and actual cash costs. A residual required saving is not independently identified efficiency. Cost audit. |
| Growth consumes cash | Working capital, capex, leases and acquisition cash separate EBITDA from free cash flow. | Require returns on reinvestment and avoid counting strategic-stake profits both in operations and in the investment bridge. Cash schedule. |
| Discount-rate choice materially changes value | 8.57835% is the selected investor-hurdle midpoint; the conventional WACC reference is about 10.10%. Terminal cash contributes roughly two-thirds of operating value. | Treat the lower hurdle as an explicit judgment. Retest required return, terminal growth and reinvestment together. Rate build. |
| Monsoon and trade policy have several channels | Rainfall affects farm income, food demand, sourcing and input costs. Agri also depends on export permission and commodity prices. | GDP-linked Agri is a simplifying convention, not a causal law. Joint weather, inventory and margin shocks are not fully represented. Risk watchlist. |
| More trials do not eliminate model risk | The first 500 source states were independently replayed before extending the same seed stream to 5,000. | Sampling precision improves, but missed risks and optimistic fixed conditions remain. One market price also cannot uniquely reveal every investor expectation. |
Management plans: progress, shortfalls and open tests
The FY2022–FY2026 Board/business and subsidiary reviews support the observations below. “Supported” means evidence of implementation, not that management beat formal numerical guidance. Most plans are qualitative. Company explanations are not independent causal proof; external cycles and reporting scope also matter. FY2026, FY2025, FY2024, FY2023, FY2022.
| Record / period | Plan or strategy | Observed outcome | Learning for the forecast |
|---|---|---|---|
| M01 — Cigarettes, FY22 | Improve product availability and portfolio execution as activity normalizes. | FY22 management reported volumes above pre-pandemic levels in the second half. FY23 described further recapture from illicit trade. | Execution direction supported, alongside reopening and a more stable tax environment. Recovery growth is not a secular volume-growth estimate. |
| M02 — Cigarettes, FY23 | Portfolio differentiation and legal-market recapture under tax stability and enforcement. | FY24 described consolidation on a higher base. Consolidated net cigarette revenue growth slowed from about19.4% in FY23 to6.7% in FY24. | The earlier growth rate was not sustained. Do not infer that GDP alone explains legal cigarette volumes. |
| M03 — Cigarettes, FY24–FY25 | Premium offerings, competitive-market interventions and cost management. | Net cigarette revenue continued growing, but consolidated EBITDA/net cigarette revenue declined from about73.7% in FY24 to72.3% in FY25 and70.3% in FY26. Management identified expensive leaf inventory. | Revenue execution supported, margin protection incomplete. Cost pressure predates Q1 FY27 and cannot all be labelled a recent tax charge. |
| M04 — Cigarettes, FY26 | Stagger pricing, change the portfolio and realign capacity after the February tax change. | July management commentary describes implementation, but no quantified full-recovery date or retained-realization target. | Implementation underway. Economic outcome unresolved. Add a bounded recovery mechanism rather than assume either zero recovery forever or complete restoration. |
| M05 — FMCG, FY22 | Premiumisation, sourcing efficiencies, pricing and cost measures to offset inflation. | Standalone margin held near9.1% in FY22. FY23 EBITDA growth exceeded sales growth. | Direction supported, with reopening and mix effects. Maintaining margin in one inflation episode does not eliminate future commodity risk. |
| M06 — FMCG, FY23–FY24 | Scale brands and channels while expanding profitability. | Consolidated segment EBITDA margin reached about11.2% in FY24, up from9.2% in FY22. | A meaningful operating improvement. Use achieved economics to inform a recovery range, without extrapolating every historical basis point of expansion. |
| M07 — FMCG, FY25 | Sustain marketing/trade investment, premiumisation and channel reach despite inflation and local competition. | Consolidated margin fell to about9.9% in FY25 and remained around10.0% in FY26. External sales growth was about4.8% and10.5% respectively. | Mixed. Growth and distribution improved, but margins did not rise continuously. Marketing and channel costs must remain funded. |
| M08 — FMCG distribution, FY25 | Expand direct reach and newer channels. | Management reported availability in nearly7m outlets and direct service to more than one-third. FY26 described broad-based category and NewGen-channel growth. | Execution indicators support a small company-growth premium. Outlet counts and category claims do not establish incremental cash returns or organic acquisition-adjusted growth. |
| M09 — Agri, FY22 | Use sourcing relationships and exports across wheat, rice, spices and leaf. | Strong FY22 performance, followed by wheat/rice restrictions in FY23 and much weaker external revenue in FY24. | Success in a favourable trade window, not a smooth GDP-linked business. Separate crop output, commodity prices and export permissions. |
| M10 — Agri, FY23–FY25 | Increase value-added products and diversify export relationships. | Value-added products continued to grow while bulk trading opportunities were restricted. FY25 benefited when some restrictions eased. | Strategy has operating support, but the aggregate business remains cyclical. Do not confuse bulk-price turnover with volume growth or a recurring margin advantage. |
| M11 — MAARS, FY22–FY26 | Launch and scale a digital-plus-local agricultural platform. | FY26 review reports more than2.6m connected farmers and over2,100 FPOs across11 states. | Adoption milestone supported. Standalone monetization, incremental profit and returns on platform investment are not separately established. No additional platform valuation premium is added. |
| M12 — Paper, FY22–FY23 | Integrated pulp, value-added boards, capacity and manufacturing efficiencies. | Revenue and margins improved during recovery. Consolidated segment EBITDA margin was about29.1% in FY23. | Positive execution in a favourable cycle. This peak should not become a perpetual normalized margin. |
| M13 — Paper, FY24–FY26 | Broaden products and customers, control costs and strengthen fibre supply. | Imports, weak realizations and wood inflation compressed consolidated margin to about13.2% in FY26. The second half improved as wood costs moderated and import-price protection helped. | Economics fell short of a simple structural-margin story. External factors matter, but integration did not immunize the business. Retain broad cyclical margins and capex. |
| M14 — CPP, FY25–FY26 | Acquire capacity, diversify the footprint and improve sourcing/customer economics. | Completion was announced for1-Aug-2026. Future synergies are not yet a multi-year audited outcome. | Transaction implementation completed. Investment success remains unproven. Deduct consideration and fund working capital; do not recognize an unsupported synergy premium. |
| M15 — IT services, FY22–FY23 | Expand cloud, digital manufacturing, strategic accounts and partnerships. | Consolidated total income rose16.6% in FY23, but PBT fell from₹719.64cr to₹529.66cr. Management cited partnership, staffing and capability costs. | Revenue strategy worked, immediate profit conversion did not. Separate income from operating revenue, and costs from investment aspirations. |
| M16 — IT services, FY24–FY25 | Large strategic deals, broader delivery footprint, cloud capabilities and Blazeclan acquisition. | FY24 income/PBT recovered. FY25 operating revenue grew13.8%, while subsidiary-group PAT slipped from₹463.13cr to₹449.82cr. | Growth supported, shareholder profit conversion mixed. Acquisition accounting and capability spending cannot simply be assumed away each year. |
| M17 — IT services, FY26 | AI labs, outcome-based services, engineering hubs and client-led growth. | Management reported approximately14% revenue growth while acknowledging weak discretionary demand and AI-related price compression. | Opportunity and cannibalization risk coexist. Keep a separate growth/margin range, not an India-GDP proxy. The proposed Happiest Minds transaction is a future execution item. |
| M18 — Hotels, FY22–FY25 | Recover occupancy and use an asset-right expansion strategy. | Strong post-pandemic operating recovery, followed by implementation of the demerger from1-Jan-2025. | Operating and corporate-action milestones supported. Post-demerger hotel growth must not be added to consolidated operating forecasts; the retained investment sits in the bridge. |
| M19 — Nepal, FY25–FY26 | Reinforce the cigarette franchise and expand newer FMCG categories. | Subsidiary reporting shows profit growth, but also highlights Nepal-specific tax, political and weather risks. | India GDP and tax assumptions do not describe every consolidated cigarette rupee. The current consolidated aggregate remains an approximation until India/Nepal drivers are separately built. |
| M20 — New businesses, FY26 | Scale nicotine derivatives, sustainable packaging and fresh food. | Initial commercial activity is reported, but mature segment returns are not established. | Maintain opportunities in existing segment upside ranges or the watchlist. Adoption, GMV and annualized run rate are not interchangeable with recognized revenue or free cash flow. |
Next review checklist: compare disclosed cigarette volumes and retained realization with the recovery path; separate FMCG organic growth from acquisitions; track segment margins, leaf/wood costs, working-capital days and capex returns; record any tax, rainfall, export-policy or material transaction changes. Keep the previous assumption and date visible when revising a view. No numerical management score or historical “hit rate” is inferred.
What actually drives forecast revenue?
| Driver | Central assumption | How it enters the forecast |
|---|---|---|
| Cigarettes | 3% normal volume; 5% price/mix | Multiplicative, not additive: (1+volume) × (1+price) – 1, plus separately modelled transition recovery. |
| FY27 disruption | H1 volume -7%; H2 at prior-year run-rate; retained-price shock -18% | Volume run-rate recovery does not reverse a producer net-price loss automatically. |
| Catch-up | 85% of retained-price shock recovered by FY31 | Cumulative catch-up weights: 0%, 20%, 50%, 80%, 100% of the selected recovery fraction. |
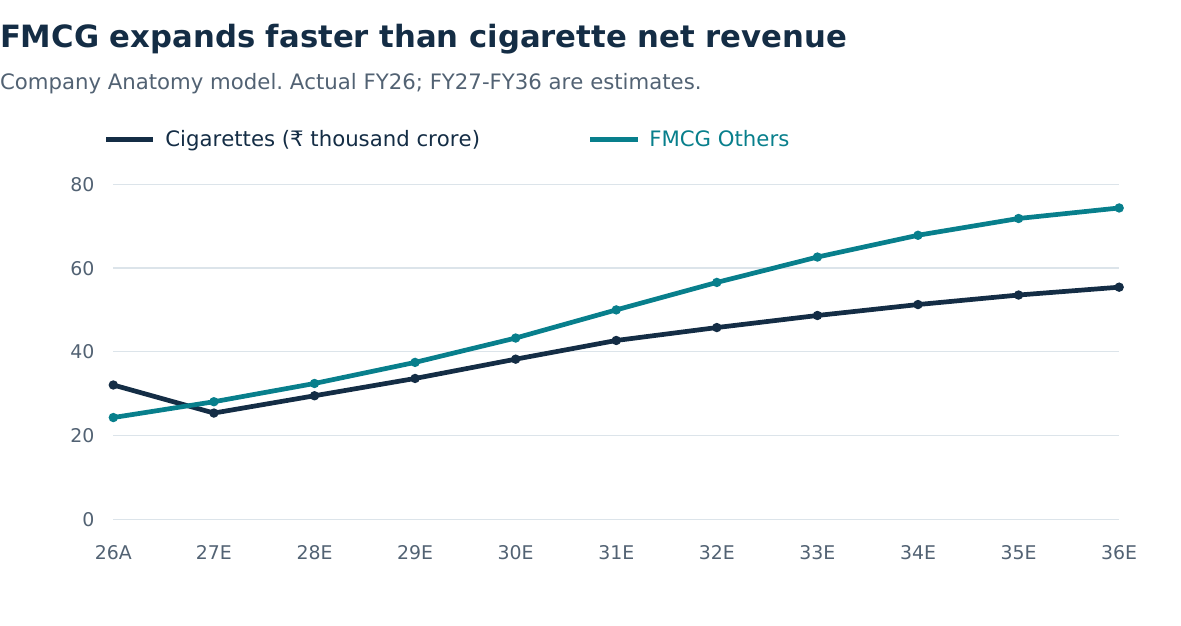
| FMCG | ₹50,000cr by FY31; 15.5% CAGR | Target achieved in every trial. GDP is not added again to this same target. |
| Agri / Paper / Others | 6.5% / 6% / 10% before fade | Agri equals central real GDP by user convention; not a proven nominal-revenue relationship. |
| Acquired paper capacity | ₹2,000cr FY27; ₹3,200.63cr FY28 | CPP contribution is a provisional run-rate estimate, not audited future revenue. |
Operating leverage must be earned
| Item | Central treatment | Critical qualification |
|---|---|---|
| Cigarette cost structure | 30% of normalized operating costs fixed/mixed; 70% variable | Analytical classification, not disclosed cost accounting. |
| Margin endpoints by FY31 | Cigarettes 74%; FMCG 16%; paper 20% | Above FY26 outcomes; require price, mix and input-cost normalization. |
| Other segment margins | Agri 8%; Others 16% | Fixed assumptions, applied to total segment sales. |
| Corporate / fixed costs | 5% annual growth before fading to 3.5% | Revenue growth above cost growth creates operating leverage. |
| Implied cigarette variable cost/unit | FY27-FY31: +4.0%, +0.8%, +0.4%, -1.4%, -5.7% | After FY27 this is a residual implied by the margin path, not independently identified savings. |
A one-time tax-rate rise can permanently change the level of legal volumes or retained realization. “No further tax rise” does not imply full recovery. The central case grants recovery but leaves failure possible in the retained-price range.
Growth consumes cash before it creates value
| Assumption | Model input | Cash-flow effect |
|---|---|---|
| Receivables / inventory / payables | 18 / 205 / 60 days | Receivables use sales; inventory/payables use materials cost. |
| Materials / revenue | 44% | Higher procurement costs can raise stock financing needs. |
| Other operating WC | -5.56% of revenue | Historical ratio proxy; not a detailed tax/payroll ledger. |
| Opening operating WC | ₹12,630.52cr | Increase in operating WC reduces FCFF. |
| Acquisition cash / acquired WC, FY27 | ₹3,528cr / ₹500cr | Acquired WC excluded from organic change to avoid double counting. |
| Organic capex, FY27-FY31 | At least ₹20,000cr and at least 3.5% of sales | Higher of the two; later capex fades consistently with terminal returns. |
| Cash tax / depreciation | 25.168% / 2.2% of revenue | Corporate operating tax, not investor personal tax. |
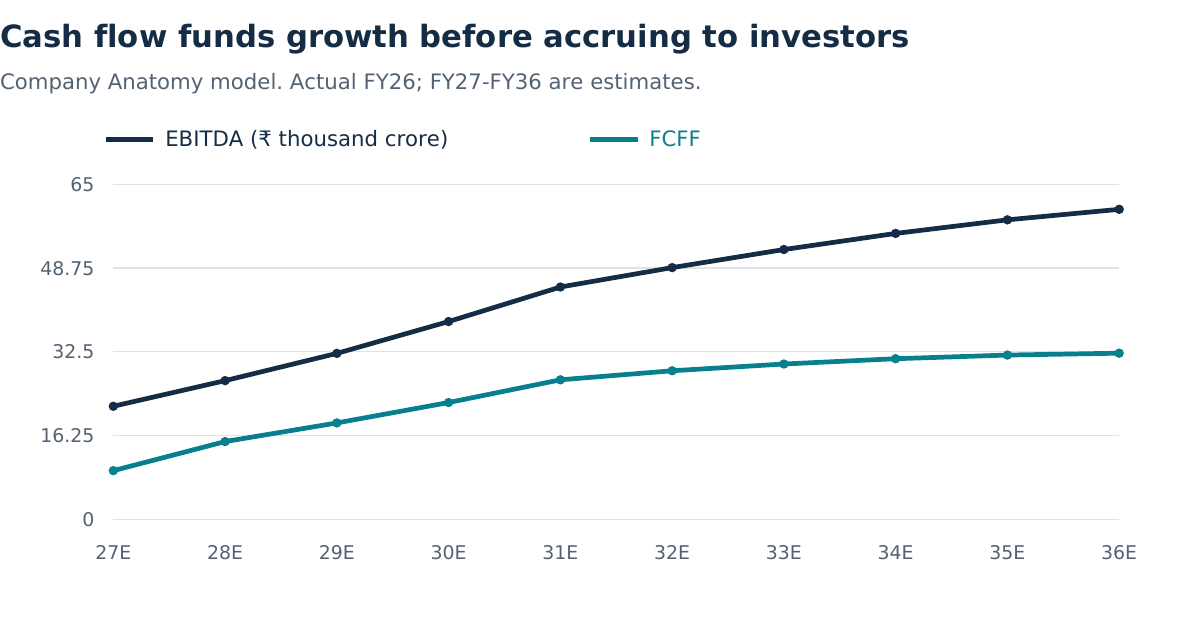
Ten years of sales, earnings and cash flow
| Year | Net sales | EBITDA | Margin | EPS ₹ | FCFF |
|---|---|---|---|---|---|
| FY26A | 81,393 | 27,457 | 33.7% | 16.51 | Not shown |
| FY27E | 82,223 | 21,942 | 26.7% | 13.44 | 9,458 |
| FY28E | 93,790 | 26,909 | 28.7% | 16.20 | 15,098 |
| FY29E | 105,163 | 32,193 | 30.6% | 19.15 | 18,710 |
| FY30E | 117,955 | 38,365 | 32.5% | 22.60 | 22,667 |
| FY31E | 131,677 | 45,061 | 34.2% | 26.34 | 27,070 |
| FY32E | 143,775 | 48,823 | 34.0% | 28.37 | 28,824 |
| FY33E | 155,039 | 52,326 | 33.8% | 30.26 | 30,133 |
| FY34E | 165,000 | 55,453 | 33.6% | 31.94 | 31,160 |
| FY35E | 173,208 | 58,086 | 33.5% | 33.36 | 31,869 |
| FY36E | 179,270 | 60,124 | 33.5% | 34.45 | 32,231 |
FY26-FY36 revenue CAGR is 8.22%; continuing EPS CAGR is 7.64%. EPS falls in FY27 then recovers. Flat treasury income, financing, associates, minorities and dilution explain why EPS does not exactly track sales or EBITDA. These are estimates, not audited future financial statements. [S10]
| Metric | FY26-FY31 | FY26-FY36 |
|---|---|---|
| Cigarette net revenue CAGR | 5.9% | 5.6% |
| FMCG external revenue CAGR | 15.5% | 11.8% |
| Group net revenue CAGR | 10.1% | 8.2% |
| Continuing EPS CAGR | 9.8% | 7.6% |
FY27 group revenue grows only about 1% despite faster FMCG and acquired paper capacity. Cigarette net revenue contracts about 21%. The initial earnings-level loss is not removed by calling the tax increase “one-off”; the model must earn it back through subsequent pricing, volumes and cost normalization. [S10]
The original DCF: a transparent starting point
| Component | ₹ crore |
|---|---|
| Present value of FY27-FY36 FCFF | 150,385.97 |
| Present value of terminal operations | 288,446.51 |
| Enterprise value | 438,832.48 |
| Net non-operating equity bridge | 32,343.89 |
| Equity value | 471,176.37 |
| Diluted shares (crore) | 1,253.2468 |
| DCF value per share (₹) | 375.96 |
Formula: enterprise value = Σ FCFFt/(1+r)^t + terminal FCFF/[(r-g) × (1+r)^10]. Equity value = enterprise value + net non-operating bridge. Divide by diluted shares. Year-end discounting is used. [S10]
| Category | Avoid this valuation error |
|---|---|
| Cash, deposits and treasury investments | Do not assume all investments are unrestricted cash; account for liquidity, ownership and valuation basis. |
| Associate / strategic stakes | If separately valued, exclude their profits from operating FCFF. Do not also capitalize the same income stream. |
| Operating assets, debt and other claims | Working capital belongs in operations; debt and non-controlling interests must be treated consistently with cash-flow ownership. |
| Post-base-date cash movements | Reconcile acquisitions, dividends, net cash generation and dilution before comparing with a current share price. |
Bringing the valuation to today’s comparison date
The earlier ₹375.96 value used a 31 March base date. Comparing it with September without accounting for the ₹8 dividend already paid would be inconsistent. We now use an explicit, estimated stub-year bridge. It is a valuation timing update, not a fresh audited September balance sheet.
| Step | Amount / rule |
|---|---|
| Elapsed fraction of FY27 | 0.468493 (171/365) |
| FY27 model FCFF | 9,457.83 |
| Recurring FCFF before acquisition cash | 12,985.83 |
| Estimated elapsed FCFF, after assumed acquisitions | 2,555.77 |
| Dividend deducted (₹8 × model share count) | 10,025.97 |
| Original non-operating bridge | 32,343.89 |
| Estimated September bridge | 24,873.69 |
| Remaining FY27 cash flow | 6,902.06 |
| September operating enterprise value | 453,636.98 |
| Indicative September equity value / share | ₹381.82 |
Method: spread recurring FY27 cash flow evenly across the year; assume the model’s ₹3,528cr acquisition cash is already spent; deduct the ₹8 final dividend paid 28 July 2026; shorten future discount periods by 171/365. Keep the remaining FY27 cash flow at year-end. Cash earns zero in this bridge. [S19] [S32]
Limitations: actual seasonality, acquisition payment schedules, share dilution, minority claims and investment market values are not fully refreshed. These can change the answer. A ₹5,000cr adverse change in the non-operating bridge reduces value by about ₹3.99/share. No precision beyond rounded rupees is economically warranted.
The discount rate is a judgment with a large price
| Rate item | Value | Interpretation |
|---|---|---|
| Selected hurdle | 8.57835% | Midpoint of a user-specified range; not an independently estimated WACC. |
| Simulation bounds | 7.0167% to 10.14% | Saved 11 Sep sovereign-yield reference to user ceiling. |
| Underlying standard deviation | 0.780825 percentage points | Normal draw truncated at bounds; not a confidence interval. |
| Earlier conventional WACC reference | Approximately 10.10% | Country-risk/beta-based reference, not the selected central hurdle. |
| Terminal nominal growth | 3.5% from FY37 | Mature-growth judgment below near-term growth; not Indian real GDP. |
| Terminal incremental ROIC | 15% | Requires reinvestment of g/ROIC = 23.33% of NOPAT. |
The earlier conventional build used: (7.0167% sovereign yield – 1.7499% default spread) + 0.5132 beta × 4.20% mature equity premium + 2.7202% country equity premium ≈ 10.14% cost of equity. A 1% assumed debt weight, a 0.75% borrowing spread and corporate tax shield yield about 10.10% WACC. Revenue-weighted global industry betas are an imperfect proxy for business-value weights. [S11] [S12] [S10]
An FD yield plus an explicit equity premium is an investor hurdle, not automatically WACC. Deposit credit risk, tenor and tax treatment differ from perpetual equity. No particular “RBI tax-free bond” has been identified; the model must not invent its yield or tax status. The selected midpoint leaves only 1.56 percentage points above the saved sovereign reference. This may undercompensate equity risk.
Terminal cash flows represent about 66.1% of the date-adjusted operating value. In plain English, most of the valuation depends on cash earned beyond the ten-year forecast. The 10% discount-rate test values the share near ₹300, not ₹382.
What can break the attractive valuation?
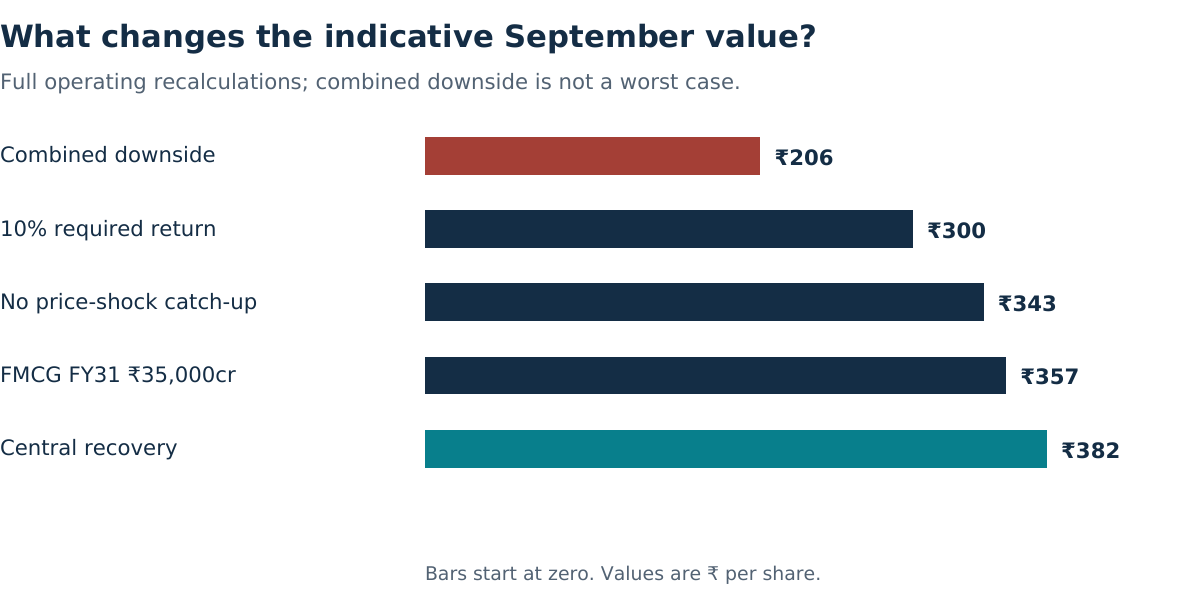
| Test | Value | What changed |
|---|---|---|
| Central | ₹382 | Original recovery assumptions |
| Higher required return | ₹300 | Discount rate 10% |
| No retained-price catch-up | ₹343 | Recovery fraction 0% |
| FMCG target miss | ₹357 | ₹35,000cr in FY31 |
| Weaker normal pricing | ₹344 | 2% net price/mix growth |
| Combined downside | ₹206 | 10% discount; ₹35,000cr FMCG; no catch-up; 2% pricing; 0% normal volume |
The combined downside is 22.7% below today’s quote even before stronger margin, weather or funding stress. It is illustrative, not a worst case or a probability estimate. This is why a 99.5% favourable model frequency must never become “99.5% chance of investment success.”
Ranges and dependencies: the model’s contract
| Variable | Range / fixed setting | Distribution or dependency |
|---|---|---|
| Annual real GDP | 4% / 6.5% / 8% | Bounded beta-PERT, concentration 4. Mean 6.33%, not mode 6.5%. |
| Real income per person | Derived; population +1% | (1+GDP)/(1+population)-1. Not independent of GDP. |
| GDP across forecast years | Latent correlation 0.60 | Common-factor convention, not a historical estimate of actual GDP correlation. |
| Normal cigarette volume | 0% / 3% / 5% | Bounded PERT; income response adds a deviation adjustment. |
| Normal net price/mix | 2% / 5% / 7% | Bounded PERT. Separate from catch-up. |
| FY27 retained-price shock | -28% / -18% / -8% | Bounded PERT; not the statutory tax rate. |
| FY27 H1 volume shock | -12% / -7% / -2% | Bounded PERT; H2 prior-year run-rate fixed. |
| Price-shock recovery | 0% / 85% / 100% | Bounded PERT; separate from volume recovery. |
| Recovered cigarette margin | 70% / 74% / 76% | Shared profitability-regime draw. |
| Recovered FMCG margin | 12% / 16% / 20% | Same regime; not an independently sampled margin. |
| Recovered paper margin | 16% / 20% / 24% | Same regime; positive rank dependence is imposed. |
| Discount rate | 7.0167% / 8.57835% / 10.14% | Truncated normal; independent of business draws. |
Fixed conditions: FMCG reaches ₹50,000cr in FY31; Agri follows GDP before fade; terminal g 3.5%; terminal ROIC 15%; selected WC days and tax rate. No additional near-term tax shock is drawn. Later adverse tax events, target failure, future acquisition funding and multi-year weather regimes are not fully represented.
See the assumptions behind the simulation
Each bar shows the percentage of the 5,000 saved scenarios falling into that interval. The dashed line is the sample median. Low / central / high inputs are documented below and in the downloadable workbook. Open each image at full size for its labels; the numerical table supplies a text alternative. These are assumed distributions, not fitted forecasts.
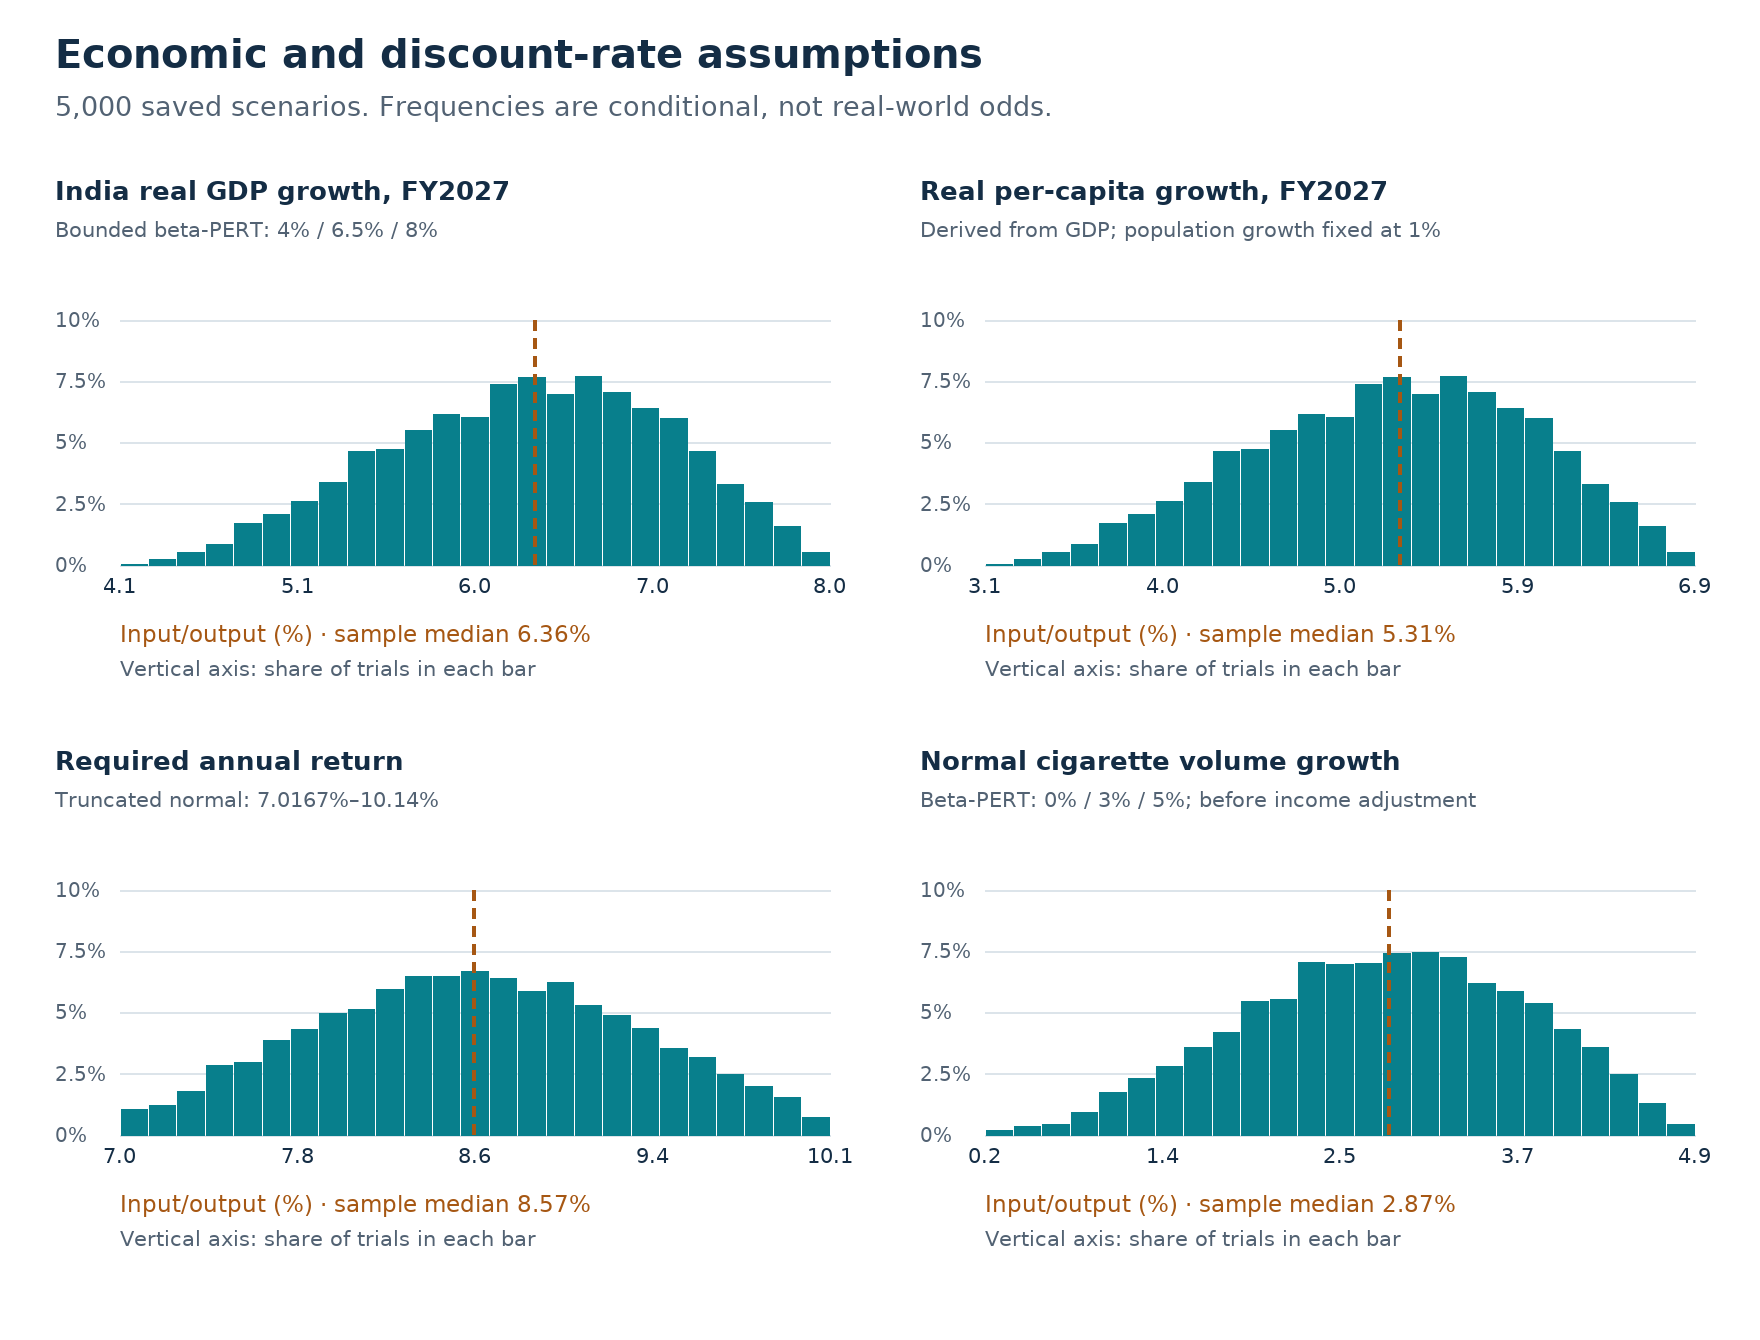
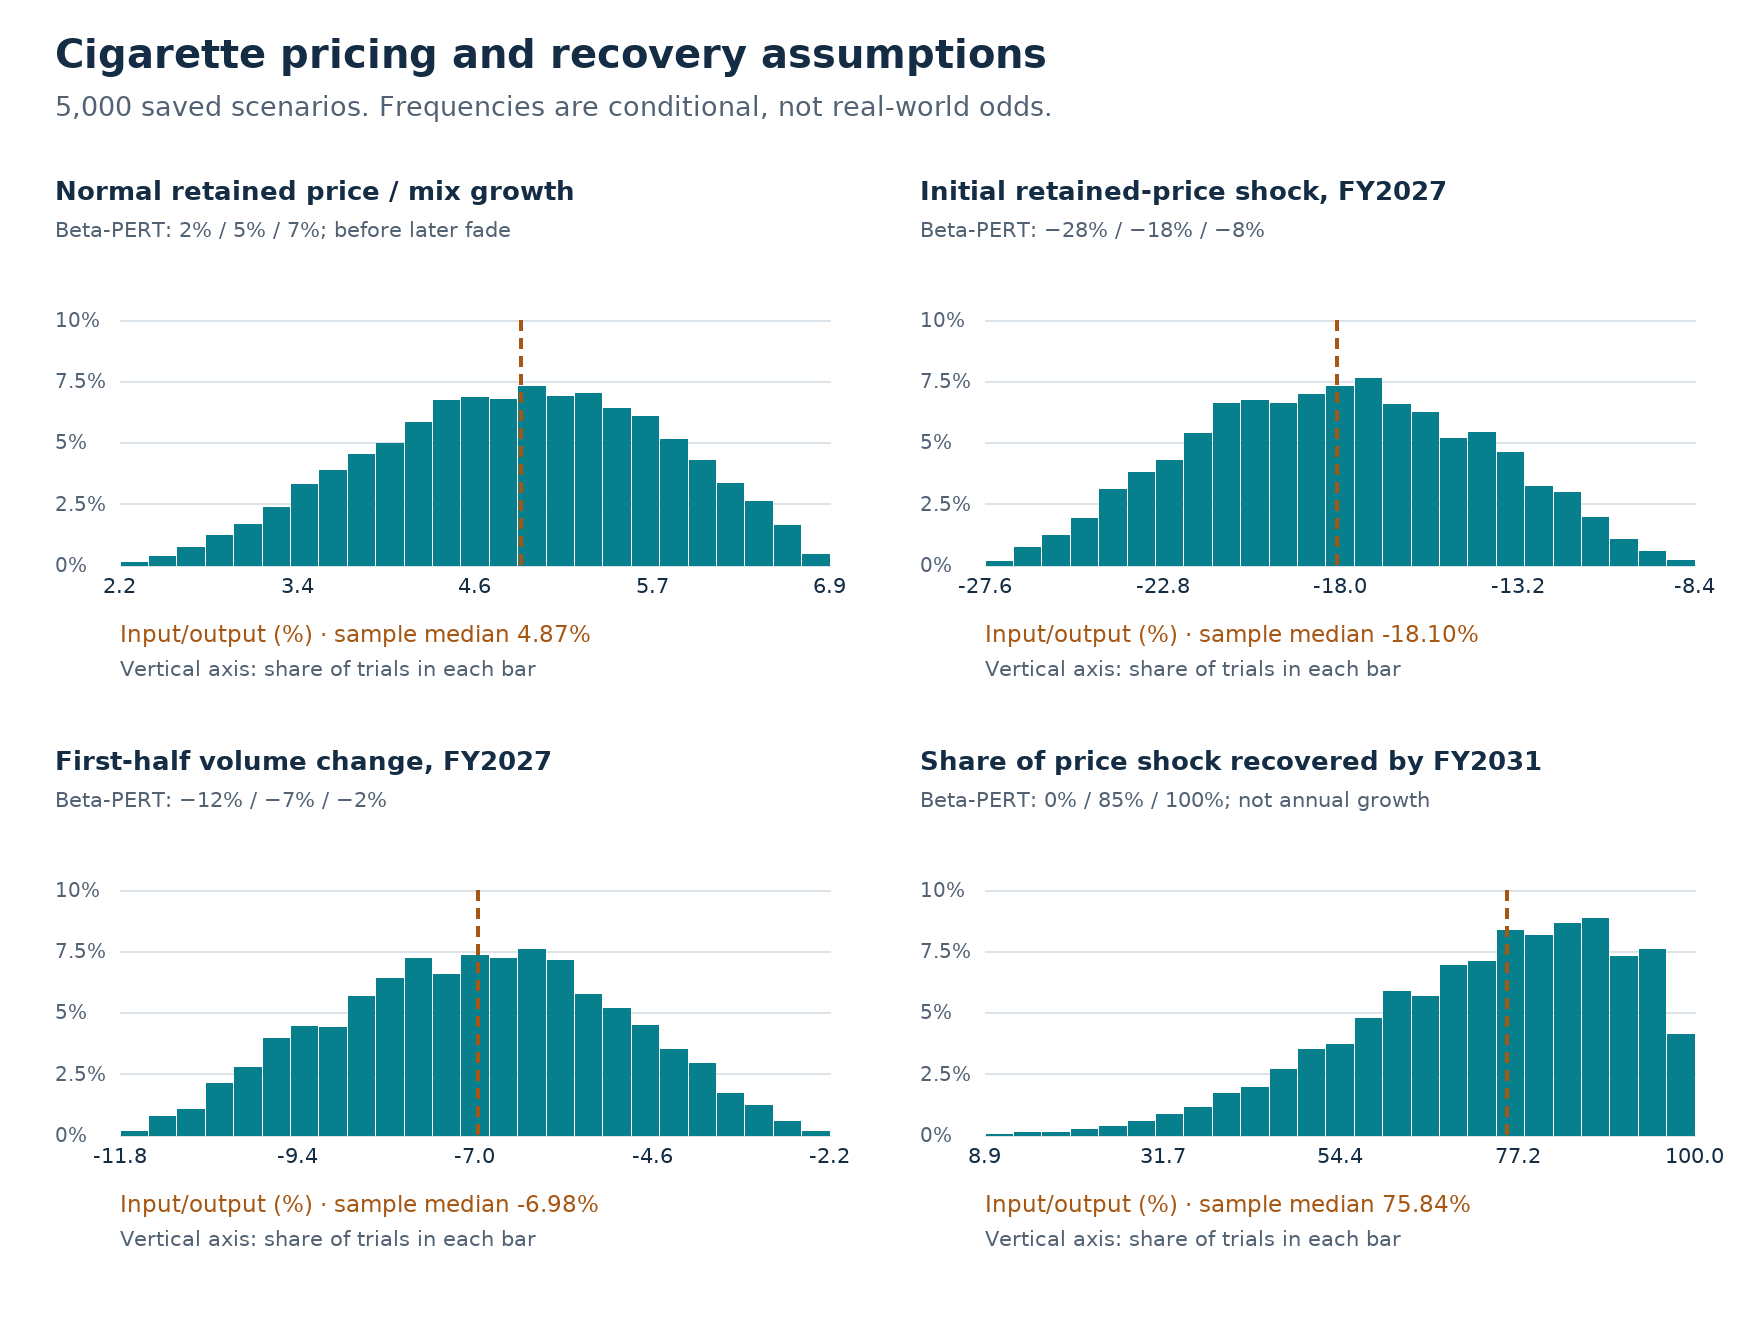
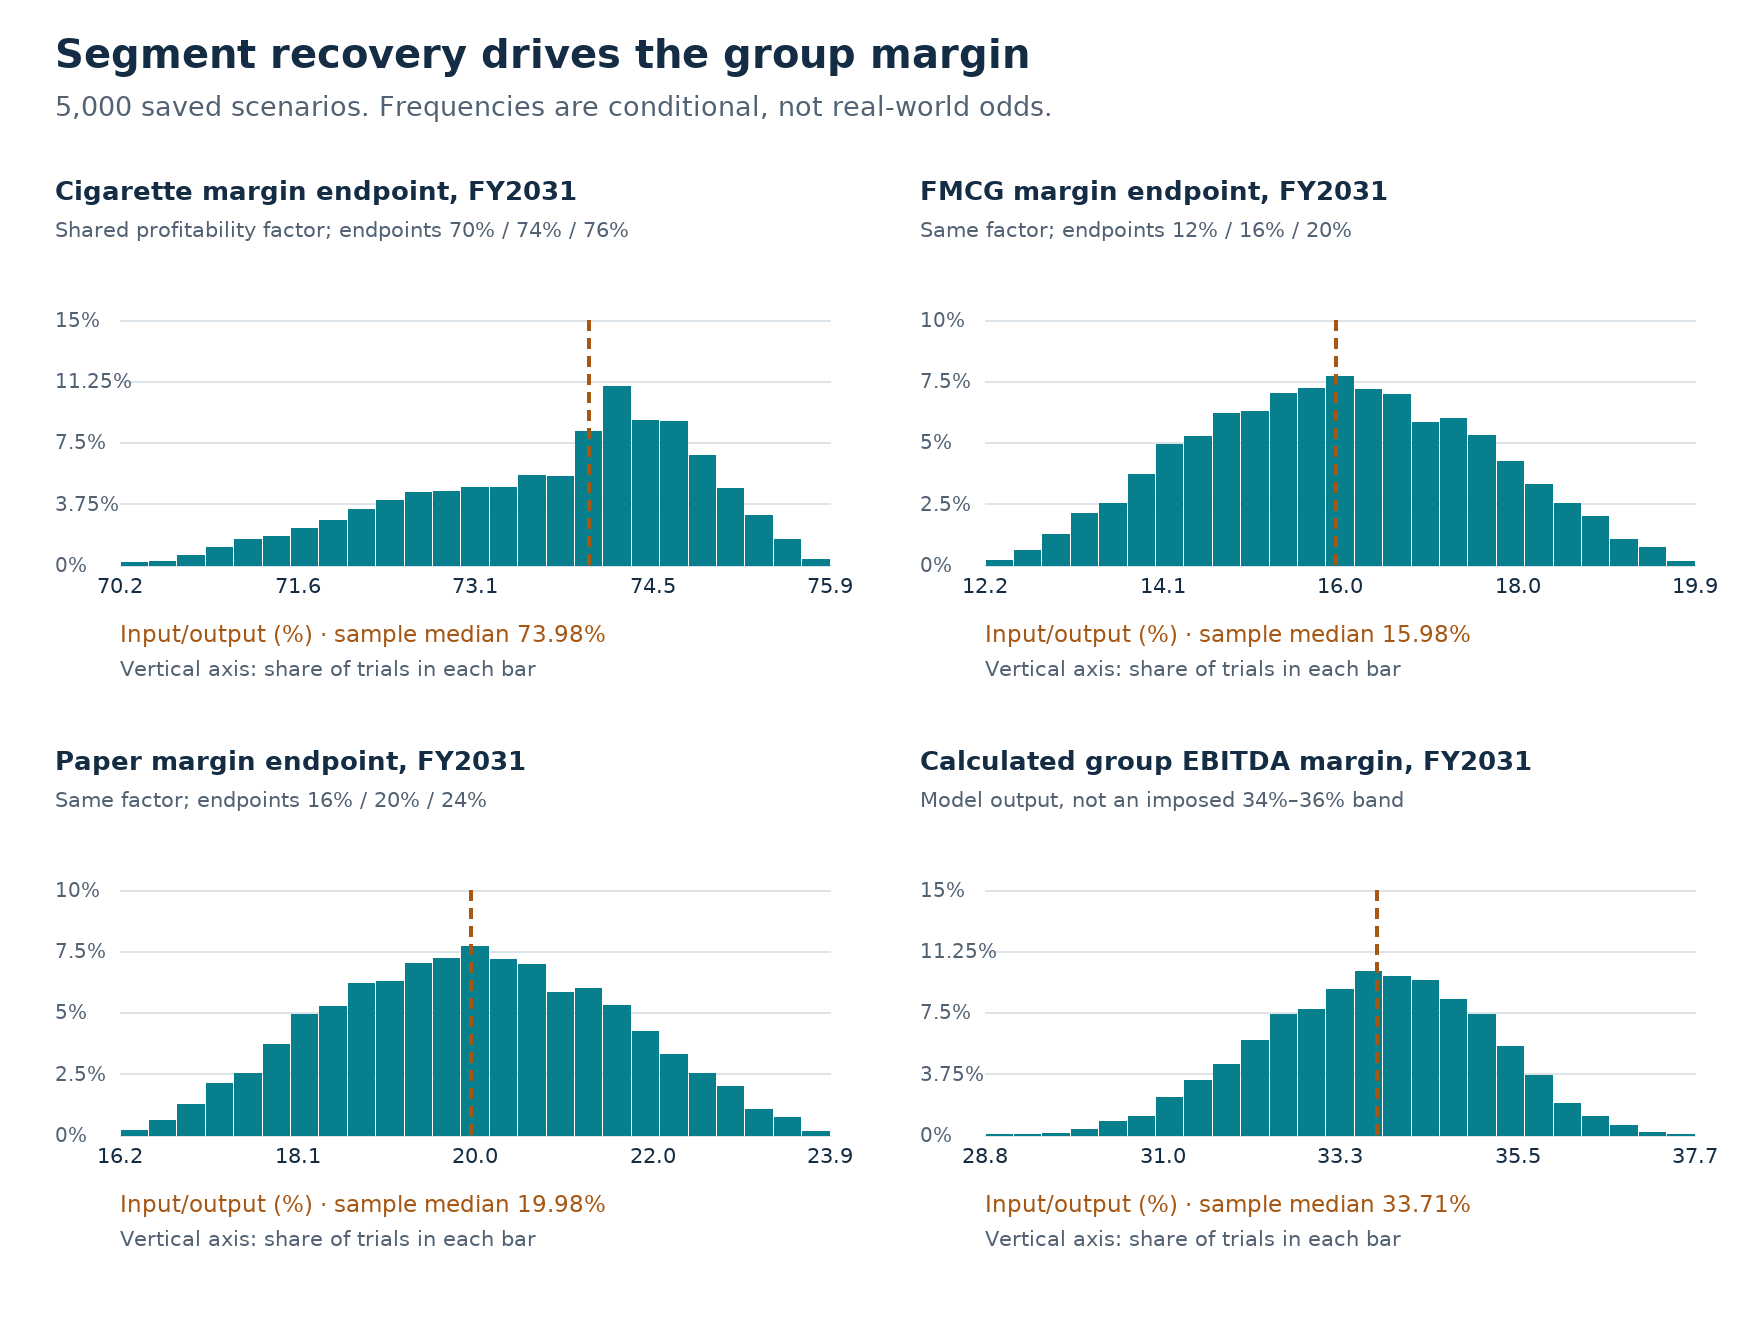
| Driver | P5 | Median | P95 |
|---|---|---|---|
| India real GDP growth, FY2027 | 4.99 | 6.36 | 7.49 |
| Real per-capita growth, FY2027 | 3.95 | 5.31 | 6.43 |
| Required annual return | 7.43 | 8.57 | 9.72 |
| Normal cigarette volume growth | 1.22 | 2.87 | 4.32 |
| Normal retained price / mix growth | 3.24 | 4.87 | 6.33 |
| Initial retained-price shock, FY2027 | -24.19 | -18.10 | -11.87 |
| First-half volume change, FY2027 | -10.11 | -6.98 | -3.94 |
| Share of price shock recovered by FY2031 | 41.67 | 75.84 | 95.80 |
| Cigarette margin endpoint, FY2031 | 71.52 | 73.98 | 75.24 |
| FMCG margin endpoint, FY2031 | 13.52 | 15.98 | 18.49 |
| Paper margin endpoint, FY2031 | 17.52 | 19.98 | 22.49 |
| Calculated group EBITDA margin, FY2031 | 31.35 | 33.71 | 35.79 |
Across years, GDP uses an assumed common latent factor with correlation 0.60. Per-capita growth equals (1 + GDP growth) / 1.01 − 1. Normal cigarette volume has a separate draw plus an income-response adjustment. The discount-rate draw is independent of operating draws. These links are modelling choices, not causal estimates. The ₹50,000 crore FMCG target, terminal growth of 3.5% and terminal ROIC of 15% are fixed, so no random-distribution chart is invented for them. Full ranges and dependencies.
What could invalidate the investment case?
| Exposure | Opportunity and opposing risk | Evidence that would change the model |
|---|---|---|
| Cigarette economics | Pricing and mix may rebuild retained revenue. Illicit substitution and downtrading can persist after taxes stabilize. | Compare disclosed volumes, realization and margin across quarters. Revenue alone cannot identify volume recovery. |
| FMCG scale | Distribution, premium products and digital channels can improve growth. Channel costs, competition and acquisitions may absorb profits. | Track organic versus acquired growth, margin, incremental capital and cash conversion, not the target alone. |
| Monsoon / crops | Good harvests support rural demand and sourcing. Poor or uneven rainfall can reduce crop availability and raise materials prices together. | IMD spatial rainfall, crop output, leaf/wood/food costs and rural demand. Do not add an arbitrary GDP penalty twice. |
| Agri trade | Value-added exports and sourcing can create profitable niches. Trade bans, logistics and commodity-price declines disrupt turnover. | External sales and contribution margins; distinguish prices, volumes and export permissions. |
| Paper / packaging | Value-added products, fiber supply and utilization may lift returns. Imports, wood, energy and expansion can weaken cash flow. | Realizations, wood cost, utilization and post-acquisition return on invested capital. |
| IT / capital allocation | New capabilities can create growth. AI price compression, integration and overpayment can destroy value. | Organic earnings/cash conversion and funded transaction economics; no unearned synergy premium. |
| Long-duration value | Durable brands support reinvestment. Regulation, tobacco health costs and a higher equity hurdle can impair terminal value. | Re-test terminal margins, growth, ROIC and discount rates together, not only one optimistic variable. |
Questions a retail investor should ask
Is ITC a buy at ₹266.20?
It is a conditional staged-add candidate in this framework, below the ₹269 safety band. That conclusion assumes the recovery case remains intact and is subject to individual suitability and adviser checks. It is not a universal recommendation for every investor.
What is the difference between value and return?
Value estimates what future business cash might be worth today. Return depends on your entry price, dividends received, future selling price, timing, taxes and costs. The model does not simulate the price at which you will actually sell.
What do DCF, EBITDA and terminal value mean?
DCF discounts future cash into today’s rupees. EBITDA is operating profit before interest, tax and depreciation; it is not free cash. Terminal value estimates the cash earned after the detailed forecast ends. Growing sales can consume cash through inventory and factories.
What does Benjamin Graham’s formula say?
The limited heuristic EPS × (8.5 + 2g), using normalized EPS ₹16.07 and separate EPS-growth input g=6, gives ₹329.44. It is not a date-aligned cash-flow target or independent proof. It cannot model tax shocks, reinvestment or changing business mix. [S10]
What will change the view?
Evidence of sustained cigarette volume/retained-realization recovery, FMCG organic growth and cash margins, or a different required return. Further taxes, poor monsoon transmission, expensive acquisitions or weaker cash conversion can lower value even if the stock falls.
Is the report free, and are trading costs included?
The report charge is ₹0. Brokerage, exchange/statutory charges and investor taxes are separate and are not included in the valuation gaps. Consult an adviser before acting; past business performance and model outcomes do not assure future returns.
Latest update — 18 September 2026
Reader update: added a company introduction and dated share-performance context, official ITC logo, clearer Research Cockpit, research-learning record and twelve assumption/output distributions across three charts. The safety-first summary now appears in the cockpit; the detailed price-band rationale remains below.
Valuation unchanged: central ₹382, median ₹370, P5–P95 ₹296–₹486; separate combined downside ₹206. This is a presentation and documentation update, not new quarterly results or a rerun with revised forecasts. The linked PDF is the original 18 September release edition; this expanded web edition adds the reader notes and assumption charts. The existing Excel companion remains the matching valuation audit file.
This section is the report’s update history. No later update has been published here yet. Future dated updates can be linked from this section and from the cockpit’s Latest update link. Check the date, changed assumptions and revised conclusion before relying on an older download.
Disclosures and publication status
Dated disclosures: 18 September 2026. Subject company: ITC Limited. Analyst: Aditya Siddharth Mehta, individual SEBI-registered Research Analyst, INH000029768; BSE enlistment 7462. Company Anatomy is the publication name. Report charge: ₹0.
Financial interests and ownership
The analyst holds ITC shares as a long-term investment. Relatives may also hold ITC shares as long-term investments. This financial interest can create a potential conflict. In response to the ownership question for 31 August 2026, the analyst states that, to his knowledge, no person within the queried analyst/associate/relative scope holds 1% or more. These are analyst declarations, not an independent holdings audit.
Compensation, relationships and conduct
The analyst declares no ITC-related compensation, including in the preceding 12 months. Apart from the disclosed holdings, he declares no ITC-related roles, service/client relationships, non-cash benefits, other material conflicts or relevant disciplinary matters involving himself or applicable associates. The declaration covers the queried officer/director/employee, market-making and public-offering relationships. He confirms compliance with the applicable personal-trading restriction under Regulation 16(2).
Analyst approval and AI assistance
The named analyst has approved the analytical views, conditional accumulation/holding/reduction framework and AI assistance, subject to the release-date price refresh, and retains responsibility for the published research. AI assisted data collection, analysis, calculations/code, readability, some writing and document production. The editorial illustration is AI-generated, not a photograph; numerical charts are calculated from the stated data. Errors may remain: readers should verify material information and perform their own due diligence. This warning does not displace the analyst’s responsibilities.
Risks and scope
This is general research, not personalized investment advice, a buy/sell solicitation, an offer, or an assurance of returns. It nevertheless contains conditional investment views. Consult a SEBI-registered investment adviser or qualified financial adviser on suitability, diversification, position sizing, taxes and costs. DCF values depend on assumptions; simulation frequencies are not probabilities of investment success. The report is free; brokerage, statutory charges and investor taxes are separate. Free public access does not itself create a personalized advisory engagement or waive regulatory protections.
Investment in securities market are subject to market risks. Read all the related documents carefully before investing. Registration granted by SEBI, enlistment with BSE and certification from NISM in no way guarantee performance of the intermediary or provide any assurance of returns to investors.
Contact, complaints and research limitations
Aditya Siddharth Mehta / Company Anatomy. Registered contact: Aditya Villa, Daksha Niwas, S.T. Road, Chembur, Mumbai, Maharashtra 400071. Email and grievance contact: adi2001me@gmail.com. Telephone: +91 7021135925. Registration and contact particulars are reproduced from the website disclosures reviewed on 17 September 2026.
Raise a complaint with the analyst first. If unresolved, use SEBI SCORES (https://scores.sebi.gov.in/) and, where applicable, SMART ODR (https://smartodr.in/). Website terms, disclosures, Investor Charter and complaint information remain applicable: https://companyanatomy.com/disclosures-disclaimers/ ; https://companyanatomy.com/investor-charter/ ; https://companyanatomy.com/grievance-redressal/ .
Release scope: price and valuation timing refreshed on 18 September 2026 before market opening, using the latest available 17 September quote. Operating evidence and forecast assumptions remain those of the 16 September analytical checkpoint. Cash/investment values and share count are carried-forward estimates, not newly observed September accounts. Changes after the information cut-off may invalidate the analysis. No undertaking to update continuously is made.
The 5,000-scenario companion contains frozen operating forecasts with live valuation formulas. The separately dated 500-trial source model is retained for operating-formula inspection and is not an updated price comparison. Neither file was newly executed in native Microsoft Excel. Statistical outputs are conditional model results, not forecasts of future traded prices.
Figures and tables are original analytical presentations of attributed facts. Third-party annual reports and research publications remain the property of their respective owners and are linked, not republished as website downloads. Distribution is intended only where lawful. Refer to the dated original report for corrections and revisions.
Sources and data notes 1
[S1] ITC Report and Accounts 2026
Consolidated revenue Note 19, p271; tax presentation p298; segment note pp299-300; Board business reviews. Audited results and classifications. Local report re-read 16 Sep 2026. Open source
[S2] ITC Report and Accounts 2025
Consolidated revenue p274, segment note pp305-306, Board/subsidiary reviews. Includes restated FY24 continuing comparisons. Open source
[S3] ITC Report and Accounts 2024
Board review and segment note pp318-320; FY24 numerical comparisons use the FY25 restatement where available. Open source
[S4] ITC Report and Accounts 2023
Board reviews pp45-46, revenue p277, segment note pp300-301. Pre-demerger scope for FY22-FY23. Open source
[S5] ITC Report and Accounts 2022
Board/business reviews pp44-45; revenue p276 and segment note pp298-299. Historical recovery context, not a forward guidance source. Open source
[S6] ITC Q1 FY2027 results media statement
31 July 2026. Consolidated and standalone highlights are separately labelled. Staggered pricing and weather/input/trade risks. Rechecked 16 Sep 2026. Open source
[S7] ITC chairman’s 115th AGM address
23 July 2026. Medium-term capex and business strategy. Company commentary is not independent verification of causal claims. Open source
Sources and data notes 2
[S8] Business Standard: Sanjiv Puri at Manthan 2026
24 February 2026. Secondary reporting of the ₹50,000 crore medium-term FMCG topline aspiration. Does not establish an FY2031 deadline. Open source
[S9] ITC Q1 FY2027 results presentation
Page 29, rounded consolidated figures: ₹18,955cr net products/services revenue and ₹5,181cr EBITDA. Saved model source; online full-PDF retrieval timed out during report preparation. Open source
[S10] Company Anatomy working model and calculation archive
ITC_DCF_Recovery_2026-09-16.xlsx: Controls, Ten Year Forecast, Costs and EPS, Simulation, Simulation Trials. 500 formula trials plus central replay. Independent saved-file verification; native desktop Excel recalculation not tested. Forecasts are author judgments. Open source
[S11] CCIL tenor-wise indicative sovereign yields
Model uses the saved 11 September 2026 9-10-year YTM of 7.0167%, not the latest website observation. Dated-source reproduction and commercial-use permission require publisher review. Open source
[S12] Aswath Damodaran, NYU Stern risk datasets
July 2026 country-risk dataset and global industry beta methodology inform the earlier conventional WACC reference. Country-risk and beta assumptions are not current ITC market-implied inputs. Open source
[S13] SEBI Research Analysts Regulations, 2014
Consolidated text last amended 25 November 2025; Regulations 19-22, pp17-19. Covers disclosures, AI use, report basis and distribution. Official copy saved and read. Open source
[S14] SEBI Master Circular for Research Analysts
6 February 2026, section 11, pp33-37: advertising and brand-name provisions. Official copy saved and read. Applicability and later RAASB directions require release review. Open source
Sources and data notes 3
[S15] Google Search Central: AI features
SEO fundamentals, crawlability, visible text and matching metadata support discoverability. Inclusion and ranking are not guaranteed. Publisher implementation reference. Open source
[S16] Google Search Central: Article structured data
Article metadata should match visible author/content and real publication details. No invented author credentials or publication URL. Publisher implementation reference. Open source
[S17] Upstox ITC quote
17 Sep 2026 15:57 IST: ₹266.20. Latest available before the 18 Sep market open; publisher quote, not independently certified exchange close. Open source
[S18] Stock Analysis ITC price history
Daily price history corroborates ₹266.20 for 17 Sep 2026. Retrieved 18 Sep before market opening. Open source
[S19] ITC shareholder general information
Final dividend ₹8/share paid 28 Jul 2026, record date 27 May. Used once in the date bridge. Open source
[S20] IBEF Indian retail industry analysis
May 2026 industry page: broad Indian FMCG market US$288bn in 2025. An industry estimate; definitions differ from company revenue. Open source
[S21] ITC Q3 FY25 results FAQ
Category ranks on printed page 9. Historical corroboration only; FY26 annual report p49 is preferred for current core ranks. Open source
Sources and data notes 4
[S22] World Bank national-income data
GNI per capita, Atlas method, current US$, 2024; indicator NY.GNP.PCAP.CD. API data saved; downloaded 16 Sep 2026. GNI is not median household disposable income. Open source
[S23] WHO tobacco profile: India
2025 report, pp2 and 8: harmonized 2023 current cigarette smoking, both sexes 15+, age-standardized; 2024 affordability. Official PDF archived. Open source
[S24] WHO tobacco profile: Indonesia
2025 report, pp2 and 8: harmonized 2023 current cigarette smoking, both sexes 15+, age-standardized; 2024 affordability. Official PDF archived. Open source
[S25] WHO tobacco profile: China
2025 report, pp2 and 8: harmonized 2023 current cigarette smoking, both sexes 15+, age-standardized; 2024 affordability. Official PDF archived. Open source
[S26] WHO tobacco profile: Republic of Korea
2025 report, pp2 and 8: harmonized 2023 current cigarette smoking, both sexes 15+, age-standardized; 2024 affordability. Official PDF archived. Open source
[S27] WHO tobacco profile: United States
2025 report, pp2 and 8: harmonized 2023 current cigarette smoking, both sexes 15+, age-standardized; 2024 affordability. Official PDF archived. Open source
[S28] World Bank: tobacco tax reform in Korea
2018 policy report, discussion of 2015 reform and incomplete rebound. Price hike 80%; stockpiling cautions and sales/tax measurement limits. Open source
Sources and data notes 5
[S29] Korea National Tobacco Control Center
Ministry of Economy and Finance sales series: 2014 4.36bn packs, 2015 3.33, 2016 3.66, 2017 3.44, 2018 3.14, 2019 3.21, 2020 3.06, 2021 3.15, 2022 3.09. Open source
[S30] WHO China tax-increase assessment
10 May 2016: retail prices up about 10%, cigarette sales down 3.3% Apr15-Mar16 vs prior year; concurrent policies also changed. Open source
[S31] Philippines Department of Health / WHO FCTC
January 2024 presentation, p8: current tobacco-smoking prevalence (not cigarette-only), GATS 2009/2015/2021. Used as a policy-sequence example, not a matched country cross-section. Open source
[S32] Company Anatomy 5,000-trial valuation companion
Seed 2026091601, original 500 independently replayed; full draw and annual-output files supplied. Live valuation formulas on frozen operating cash flows. Native Excel execution not newly tested. Open source
[S33] WHO: health taxes and consumption evidence
Eastern Mediterranean Health Journal 2024 review. Broad price-response evidence, not an ITC elasticity or pricing-success estimate. Open source
[S34] ITC FY2015 results statement
Company account of repeated excise increases and legal-market pressure. Stakeholder commentary, not an independent estimate of illicit activity or causality. Open source