Maruti Suzuki reported 236,013 vehicle sales for September 2026, up 24.4% from a year earlier. The release, published on 1 October, provides evidence of expanding volumes. For a long-term investor, the useful next question is how much additional cash those volumes can eventually generate. [1]
That requires separating three things: the strength of demand, the economics of each vehicle sold, and the capital needed to deliver it. A monthly release answers only part of the first question.
Our judgement is that September warrants closer work on Maruti’s growth quality. It does not establish that profit margins have recovered or that the shares offer a margin of safety.
What September sales show
Fact and calculation. Domestic passenger-vehicle sales were 181,838, up 36.9%. Utility vehicles grew 62.1% to 78,911; passenger cars rose 24.0% to 91,887. Exports increased 4.8% to 44,219, while sales to other manufacturers fell 44.3% to 6,542. Utility vehicles represented 43.4% of domestic passenger-vehicle volumes, versus 36.7% a year earlier. [1]
These channels have different customers, product mixes and economics. Collapsing them into one growth rate loses information that an owner needs.
The first-half comparison adds context: total sales for April–September increased 27.9%; domestic passenger vehicles grew 35.8%. That supports looking beyond a single month, while still leaving profitability unanswered. All growth rates here are calculated from the company’s reported unit totals. [1]
The base year needs examination
Maruti’s September 2025 release specifically said its domestic wholesale figure had been affected by logistical constraints late in that month. It also reported strong festive deliveries following GST reform. These are statements about the comparison period, not explanations established for September 2026. [2]
Analyst judgement. Some of the present year-on-year growth may reflect an easier dispatch comparison. The available release does not quantify how much. Describing the entire increase as fresh underlying demand would therefore be too confident.
There are two separate flows to understand. Wholesale measures vehicles moving into the distribution channel; retail concerns sales to final customers. Timing differences can arise because dealers prepare for festivals, transport schedules change or earlier orders are fulfilled.
A sound demand assessment would compare several months of like-for-like retail and wholesale evidence, then check dealer inventory and discounts. Retail registrations also need coverage and timing checks before being used as a direct match for a manufacturer’s dispatch totals.
September retail and dealer-inventory evidence is needed to distinguish sustained demand from dispatch timing. Without those checks, the release supports neither a claim that inventories are healthy nor one that they are excessive.
Vehicle mix leaves the margin question open
A changing product mix can alter average revenue per vehicle, but the unit table does not disclose model-level contribution margins. Higher selling prices can come with higher component costs, richer equipment, launch spending or discounts.
Fact and calculation. Maruti’s 31 July Q1 FY2026–27 release reported net sales of ₹49,959.1 crore, against ₹36,620.6 crore, and net profit of ₹3,352.1 crore, against ₹3,758.1 crore. That is sales growth of 36.4% alongside a 10.8% decline in net profit. The company attributed the pressure to higher material costs, aggravated during the war. [3]
The underlying financial statements confirm that these are standalone figures. “Net sales” here corresponds to sale of products; total revenue from operations also includes services and other operating revenue. The prior-year comparatives were restated following the Suzuki Motor Gujarat amalgamation. The investor presentation shows operating EBIT at 5.1% of net sales, against 8.4% a year earlier. [5] [6]
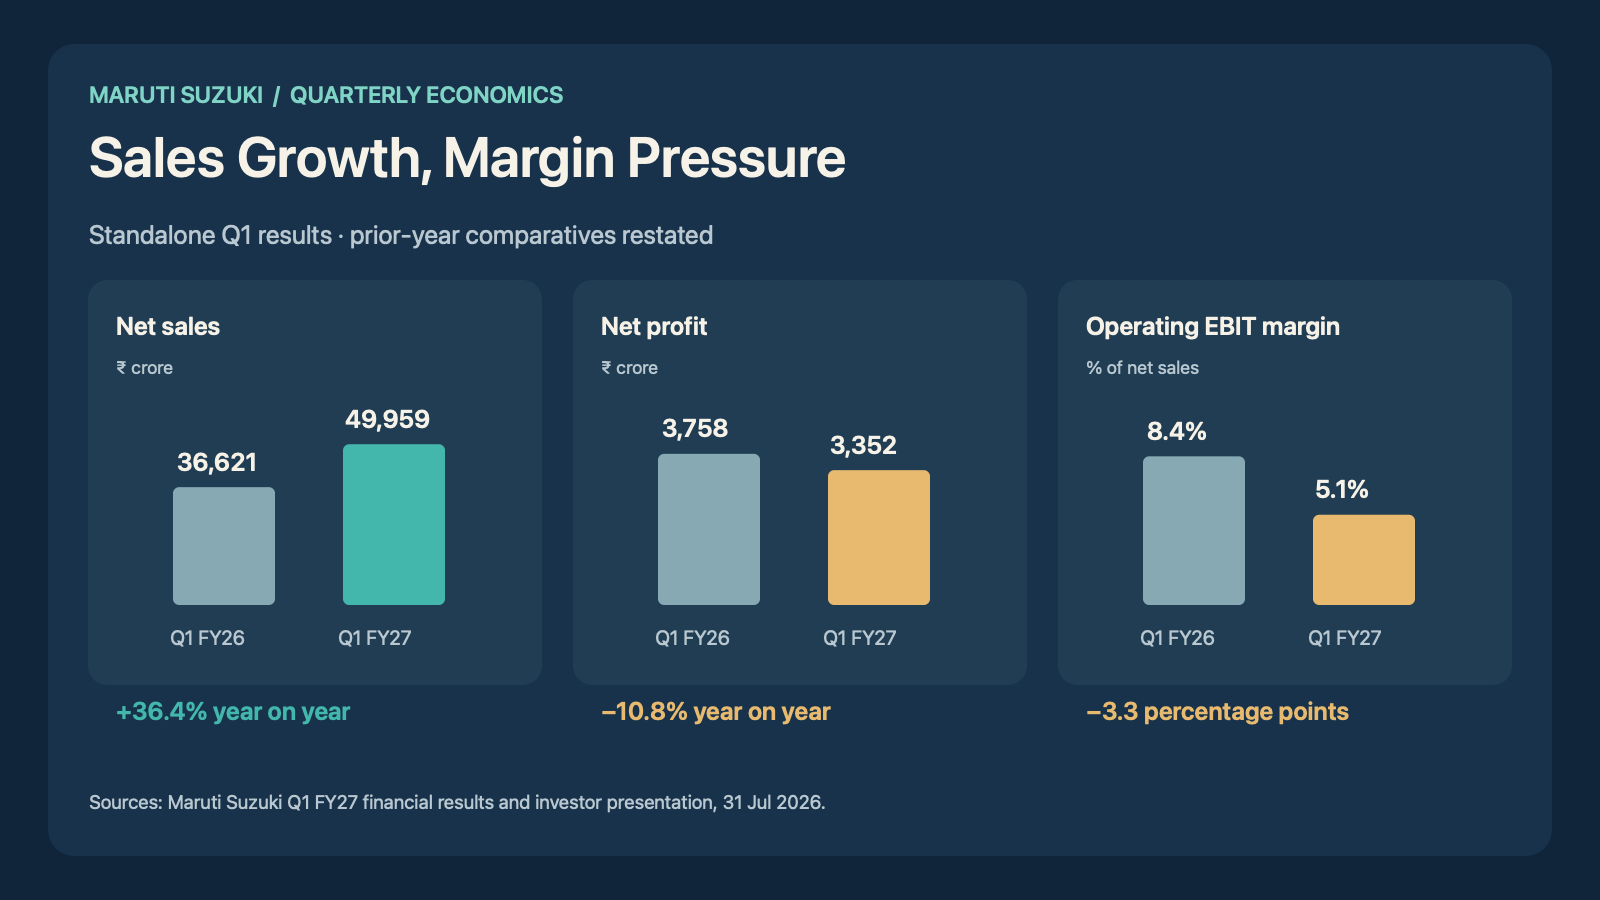
Analyst judgement. Q1 demonstrates why volume strength deserves a separate profitability test. It does not prove that the same pressures persisted unchanged into September. The next financial disclosures need to explain whether pricing, purchasing, mix and production efficiency are offsetting costs.
Capacity raises capital allocation questions
On 30 July, Maruti announced commercial production at Hansalpur Plant D. The addition brought 250,000 units of annual capacity, with estimated investment of ₹3,900 crore. It took the company’s total annual manufacturing capacity to 2.9 million vehicles. The new plant initially produces the e VITARA. [4]
More capacity can relieve a constraint. It also commits capital before the full stream of future cash is known. Investors should distinguish installed capacity, practical output and profitable demand. A factory cannot be valued simply by multiplying its rated capacity by a recent selling price. Utilisation, product allocation, ramp-up costs, maintenance spending and economic life all matter.
Nor should one month of production be annualised into a precise utilisation estimate. Maintenance schedules, shifts and differing model footprints can make that calculation misleading.
A useful framework is incremental operating profit after tax divided by the additional capital required to earn it. That capital includes more than a plant’s announced construction budget: working capital and supporting expenditure may also be necessary. A project can add revenue while earning a disappointing return on the money committed.
A cash flow test for the next results
Illustration. The following sensitivity uses assumed numbers solely to explain the mechanism. It is not a Maruti forecast.
Suppose an automaker adds ₹1,000 crore of revenue. At an incremental operating margin of 10%, that creates ₹100 crore of operating profit. At an assumed 25% cash tax rate, ₹75 crore remains before incremental reinvestment. If additional net reinvestment absorbs ₹60 crore, the illustrative free-cash-flow contribution is ₹15 crore. If it absorbs ₹90 crore, the contribution is negative ₹15 crore.
Here, net reinvestment means capital expenditure less depreciation, plus additional operating working capital. The tax rate and all amounts are invented solely to show the mechanism. A real assessment would require the company’s actual tax position, financial statements and project economics.
The lesson is about timing as well as returns. Growth investment can depress current free cash flow while creating future value. The analyst’s task is to judge whether later cash generation adequately compensates for the initial commitment and its risks.
The strongest positive case
The positive interpretation deserves equal attention. New capacity may be meeting genuine demand that the previous manufacturing footprint could not supply. The July results release linked higher sales to the second Kharkhoda plant and reported network inventory of about 13 days at the end of June. That historical observation weighs against automatically treating growth as channel stuffing. It is not a September inventory reading. [3]
The earnings call supplies another important qualification. Management said it temporarily shortened settlement lags for certain commodities from quarterly to monthly to support suppliers. It attributed approximately 110 basis points of the roughly 300-basis-point sequential commodity impact to that timing change. Those figures describe the quarter-on-quarter bridge, not the year-on-year margin decline. Management expected price increases and settlement normalisation to help later periods; those expectations still require verification. [7]
Under a favourable scenario, demand remains sound, new facilities ramp efficiently and input-cost pressure eases. Operating cash generation could then improve after investment has already been made. A temporary timing effect should not automatically be capitalised as permanent deterioration.
The countercase is that customers need increasing discounts, input costs remain difficult to recover, or additional capacity earns weaker returns than expected. Higher volumes would offer limited comfort if each incremental rupee of capital produced less distributable cash.
The available evidence is insufficient to assign either scenario a probability responsibly.
What would change the assessment
A stronger view would require consistent retail demand, reasonable channel inventories, improving operating economics and cash generation that supports the investment programme.
A weaker view would follow if dispatch growth repeatedly exceeded customer sales while discounts and inventories rose, if margin recovery depended on temporary benefits, or if the capital required for growth materially outran the resulting operating cash.
These are tests for future evidence, not claims that the adverse outcomes are occurring.
Finally, even an improving business needs a price test. A reverse valuation should ask what volumes, margins and reinvestment returns the market price already requires. This analysis does not supply a current valuation, recommendation or price target.
Company Anatomy’s research methodology calls for connecting volume growth to durable owner economics, including the costs and capital needed to earn it.
Disclosure
The author has confirmed no Maruti Suzuki shareholdings or recent purchases. The author and associates/relatives have no other financial interest, compensation, business relationship or material conflict involving Maruti Suzuki.
Regulatory information
This page provides general information about Company Anatomy and the disclosure principles applied to its research. Every dated research report must also be read with its own disclosures, assumptions, risks and source notes.
Research Analyst information
| Name | Aditya Siddharth Mehta |
|---|---|
| Capacity | SEBI-registered Research Analyst — individual registration |
| SEBI registration number | INH000029768 |
| SEBI validity from | 20 August 2026 — Perpetual |
| BSE enlistment number | 7462 |
| Business name | Company Anatomy |
| Telephone | +91 7021135925 |
| Email and grievance contact | adi2001me@gmail.com |
| Correspondence address | Aditya Villa, Daksha Niwas, S.T. Road, Chembur, Mumbai, Maharashtra 400071 |
Business activities and service scope
Company Anatomy publishes independent equity research and educational material concerning Indian listed companies. Research may include business analysis, financial estimates, valuation work, risks and analyst judgement. The website does not provide portfolio management, trade execution, custody, banking, legal, tax or personalised financial-planning services.
Independent and completely free public research
All Company Anatomy research and reports are independent and completely free to read and download. There is no subscription charge, purchase condition or obligation to open a brokerage account or trade. Free public access is a core value of Company Anatomy. Research opinions are intended to reflect analysis and evidence rather than a reader’s transactions.
Merely reading or downloading publicly available research does not by itself create a personalised investment-advisory engagement or an agreement for a separately arranged service. It does not waive investor protections or remove applicable Research Analyst obligations. Whether a particular relationship constitutes a client relationship depends on the actual arrangements and applicable law, including direct or indirect economic benefits; it cannot be settled by calling a report “free”.
Reports are not an offer, invitation or solicitation to buy or sell any security or to enter into a transaction. Where a report contains a recommendation, rating or target price, it remains research subject to applicable requirements; it is not personalised investment advice. Do not use a report as the sole basis for an investment decision.
General nature of research
Research and recommendations are general and are not tailored to an individual reader’s objectives, financial situation, risk tolerance or needs. General website information is not a personalised investment recommendation or a solicitation of an offer to buy or sell a security. This distinction does not exclude the Research Analyst’s applicable regulatory duties. Investors should make an independent assessment and obtain professional advice appropriate to their circumstances.
Sources, estimates and changes
Information is obtained from sources believed to be reliable, with preference for company filings, exchange disclosures and other primary material. Accuracy, adequacy and completeness are not guaranteed. Information may be incomplete or condensed. Forecasts, valuations, target prices and scenarios are estimates rather than facts. Opinions and estimates are the Research Analyst’s judgement as of the stated date and may change without notice.
Ownership, financial interests and material conflicts
Each research report or public recommendation must state, as applicable, whether the Research Analyst, associates or relatives have a financial interest in the subject company; actual or beneficial ownership of one per cent or more of its securities at the end of the month immediately preceding publication; or another material conflict of interest. Aditya Siddharth Mehta has confirmed that there is no business conflict of interest as of 17 September 2026. This business-conflict declaration is not a declaration that the analyst, associates or relatives have no security holdings or issuer relationships. Because holdings and circumstances can change, this general page does not make a permanent “no conflict” representation. The dated report-specific disclosure governs.
Compensation and other relationships
Each research report must disclose applicable compensation received from the subject company during the preceding twelve months, including compensation for investment-banking, merchant-banking, brokerage or other products and services; compensation or benefits connected with the research; whether the subject company was a client during the applicable period; and participation in managing or co-managing a public offering. No blanket statement is made on this page because the disclosure must be current for the subject company and report date.
Other report-specific declarations
- Whether the Research Analyst serves as an officer, director or employee of the subject company.
- Whether the Research Analyst has engaged in market-making activity in the subject company’s securities.
- Relevant associates, business relationships and any fact that could affect independence or objectivity.
- The valuation method and material risks that may prevent achievement of a stated target price.
- Any material disciplinary history, regulatory action, litigation, inspection or investigation required to be disclosed.
If a required report-specific declaration is absent or unclear, do not rely on the recommendation until clarification is obtained from the Research Analyst.
Use of artificial intelligence
Company Anatomy uses artificial intelligence to improve readability and writing, assist valuation calculations and run simulations. The extent and material role of AI in a particular report should be read with that report’s methods and source notes. The Research Analyst remains responsible for the research, human review, accuracy controls, security, confidentiality, integrity and regulatory compliance, regardless of the extent of AI use. AI can produce incorrect text, calculations or assumptions. Readers should cross-check material figures against original filings and source documents, examine assumptions and periodically consult a SEBI-registered investment adviser about their own financial circumstances. These precautions do not transfer the analyst’s regulatory responsibilities to the reader.
Valuation, forecasts and simulation limitations
Valuation models and simulations are conditional analytical tools. Outputs depend on input quality, assumptions, correlations, distributions and model design; they can omit risks and produce materially different results when assumptions change. A simulated frequency is not an observed probability of future investment success. Model values and target prices are not guarantees, promises of returns or precise forecasts. Review the valuation date, horizon, scenarios, sensitivity analysis and downside risks. Historical or simulated performance does not establish future performance.
Market risk and performance
Investment in securities market are subject to market risks. Read all the related documents carefully before investing.
Past performance is not an indicator of future performance. Prices and returns may be volatile, and an investor may lose part or all of the capital invested. Registration granted by SEBI, enlistment with BSE and certification from NISM in no way guarantee performance of the intermediary or provide any assurance of returns to investors.
Distribution, report versions and corrections
Research is intended for lawful access and use. It is not directed to a person or jurisdiction where distribution or use would breach applicable law or require a registration that the Research Analyst does not hold. Free access is not a representation of authorisation outside India. When sharing a report link, retain its date, author, qualifications and disclosures; do not present extracts or simulations as guaranteed returns. A downloaded copy reflects its stated publication date. Check the original report page for subsequent revisions and contact the Research Analyst about a suspected error.
Website, third-party links and liability
The website and its content are provided for information on an “as is” and “as available” basis. Links to third-party websites are provided for convenience and do not constitute endorsement. To the extent permitted by applicable law, Company Anatomy is not responsible for decisions made solely in reliance on general website content or for loss arising from third-party content, interruptions or technical errors. Nothing on this page excludes duties or liability that cannot lawfully be excluded.
Grievances and dispute resolution
First raise a concern directly with Company Anatomy using adi2001me@gmail.com. If the response is unsatisfactory, use SEBI SCORES. Eligible unresolved disputes may be taken to SMART ODR in accordance with the applicable process. See the Grievance Redressal, Investor Charter and Investor Complaints pages.
Regulatory sources
- SEBI Master Circular for Research Analysts, 6 February 2026
- SEBI Investor Charter for Research Analysts, 2 June 2025
Last reviewed: 17 September 2026. This page should be updated when the applicable regulatory framework or the Research Analyst’s material circumstances change.