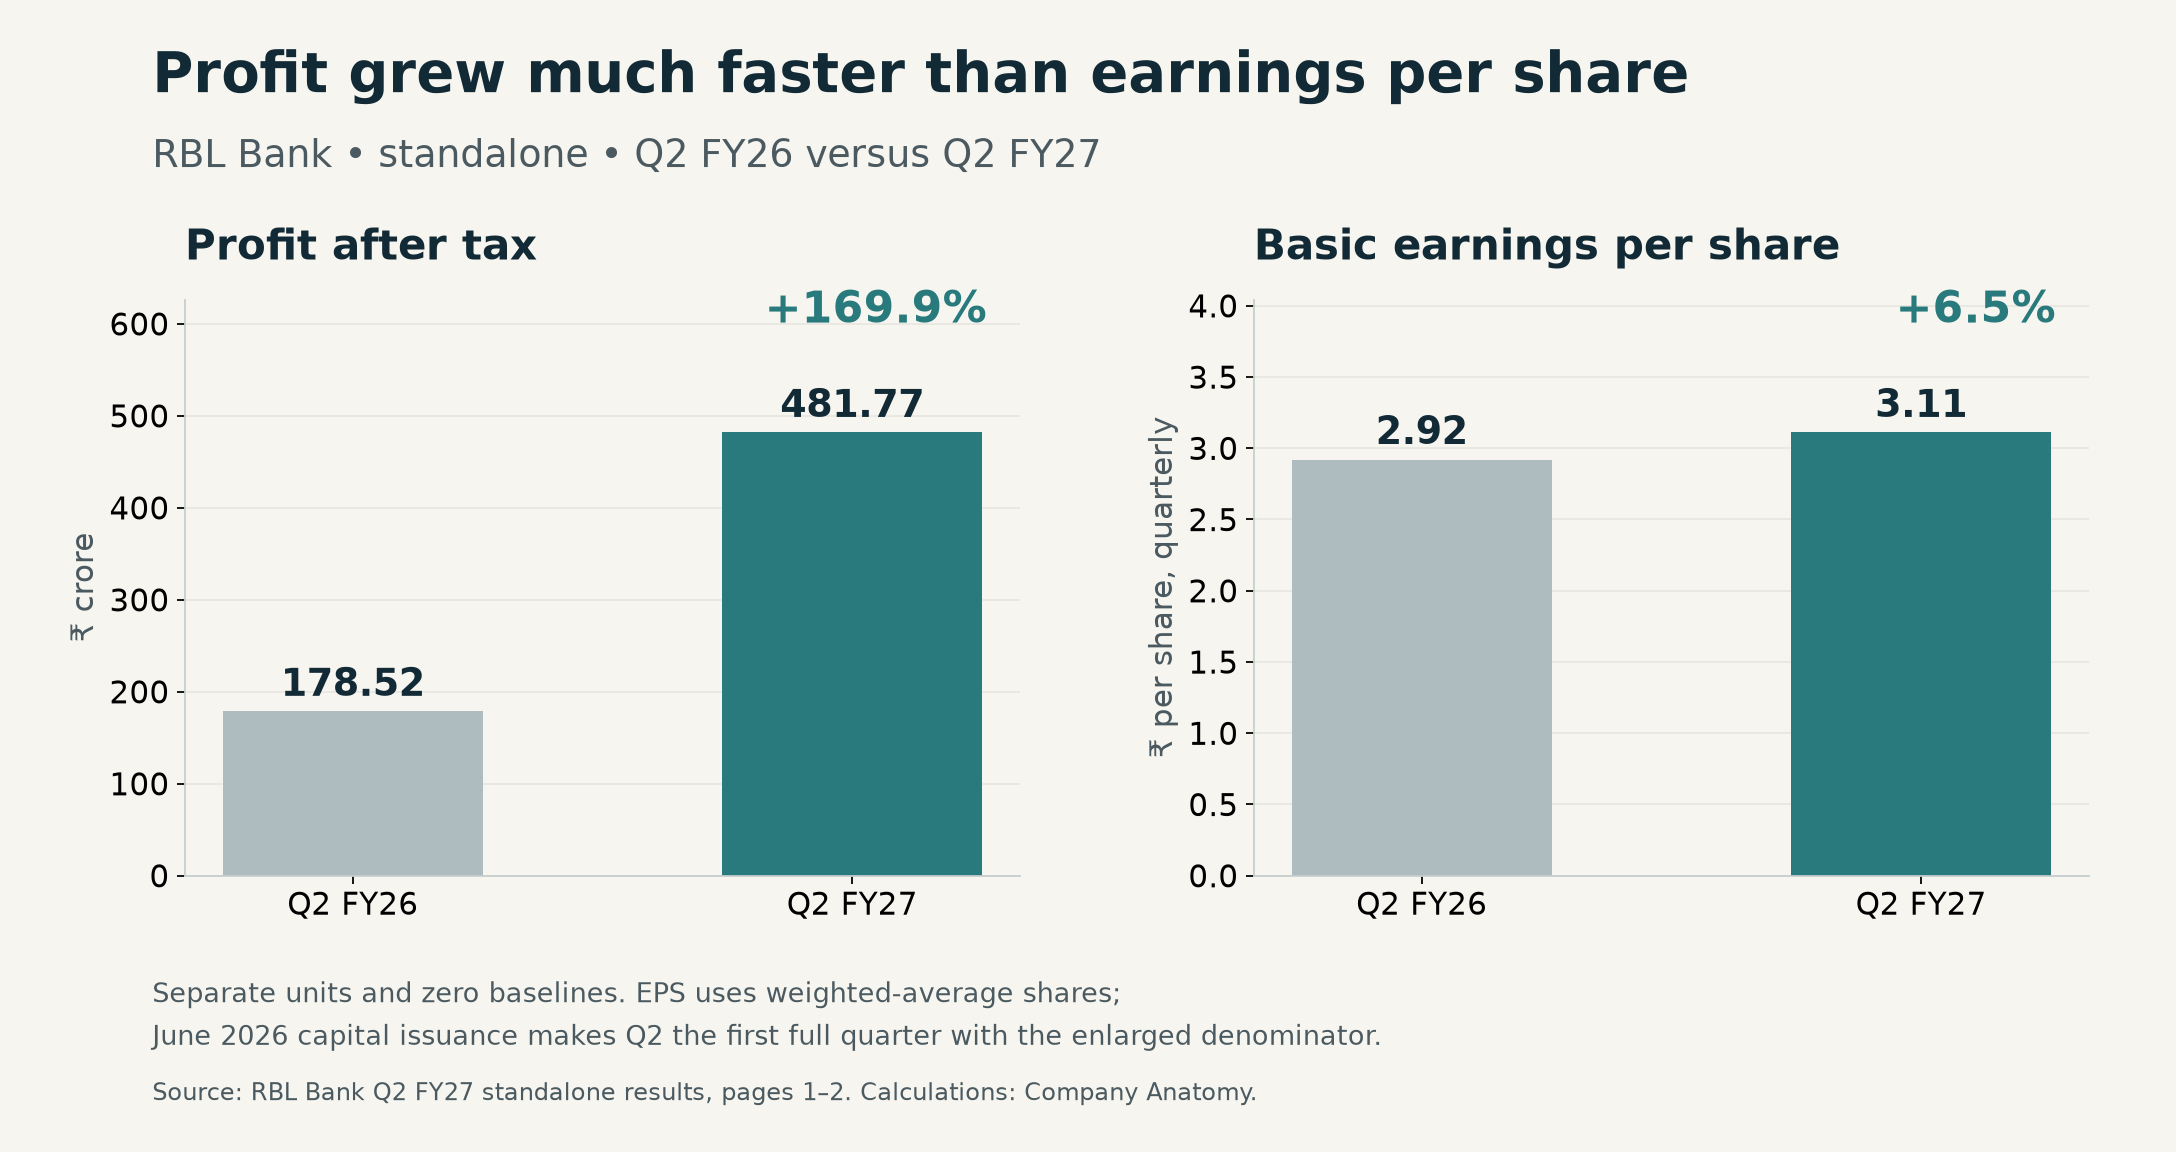
RBL Bank’s September quarter contains a striking pair of numbers. Standalone profit rose nearly 170% year on year. Basic earnings per share rose just 6.5%. Both are correct. Emirates NBD’s investment has changed the size of the bank and the number of claims on its earnings.
The useful question for an existing shareholder is whether the stronger balance sheet can produce attractive, repeatable returns on that enlarged capital base. Q2 shows progress in operating efficiency and problem loans. It also shows why headline growth needs careful unpacking.
This memo uses the unaudited results released on 12 October 2026, with earlier filings for the capital and funding context. Facts, calculations and judgement are distinguished below.
First, understand the denominator
Reported facts: Standalone profit after tax increased from ₹178.52 crore in Q2 FY26 to ₹481.77 crore in Q2 FY27. Basic EPS increased from ₹2.92 to ₹3.11. These are quarterly, non-annualised EPS figures. Standalone results, pages 1–2.
On 18 June, RBL allotted 92.913482 crore shares to Emirates NBD at ₹280 each, raising ₹26,015.77 crore. The immediate share count increased from 61.9423213 crore to 154.8558033 crore, giving the investor 60% ownership at allotment. June allotment disclosure.
Calculation: Profit growth was 169.9%; basic EPS growth was 6.5%. Q2 is the first full quarter with the expanded share denominator. Q1 included the new shares for only part of the quarter, so its ₹3.38 EPS is an awkward sequential comparator even though Q2 profit was higher. EPS uses weighted-average shares, not the closing share count.
A smaller ownership percentage does not automatically mean value destruction. The bank received substantial cash for the new shares. As our Bajaj Finance capital-raise memo explains, issue price and subsequent returns matter alongside dilution. RBL’s next test is what the money earns.
There is genuine operating improvement
Operating profit before provisions increased from ₹728.39 crore to ₹1,396.13 crore. Provisions and contingencies excluding tax also increased, from ₹499.70 crore to ₹766.53 crore. Thus, the profit recovery did not come from a year-on-year reduction in that aggregate charge. Standalone results, page 1.
The bank reported 37% growth in net interest income while operating expenses increased 3%. Its cost-to-income ratio improved from 70.67% to 56.48%. That is meaningful operating leverage: income grew much faster than the cost of running the institution. However, sustaining the improvement depends on how much income repeats as the balance sheet changes. Q2 release, key financials and ratios.
There is an identifiable capital-related mechanism. On the July call, management said roughly ₹10,000 crore had retired expensive borrowings and deposits carrying approximately 7.25% cost; the balance was placed in short-term market instruments. Avoiding funding expense can improve earnings before new lending is fully built out. Q1 FY27 call transcript.
Judgement: This benefit is economically real. It should not be mistaken for proof that every rupee of fresh equity has already found an attractive long-term use. The next stage requires profitable deployment after credit losses, funding costs and operating expenses.
Funding growth needs a second reading
The investor presentation reports 34% deposit growth, but only 6% excluding FCNR deposits. FCNR deposits are foreign-currency deposits from non-residents. In September, RBL disclosed approximately US$3.40 billion mobilised under the RBI swap facility, supported by Emirates NBD and its affiliates. It also disclosed approximately US$1.08 billion of loans against those deposits. These figures were provisional and translated at the August-end exchange rate. September disclosure; Q2 presentation, page 3.
This is evidence that the new relationship can bring funding. It leaves a separate question about the bank’s everyday deposit franchise. Average CASA deposits, covering current and savings accounts, grew 5%; the average CASA ratio was 24%. Granular deposits below ₹3 crore grew 16% to ₹68,877 crore. These are useful measures of breadth and stability alongside the headline total. Q2 release.
The asset side needs the same care. Secured retail advances grew 52%, but the presentation identifies roughly ₹10,300 crore of loans against FCNR deposits within that category. Deposit-backed lending has different economics from building a housing or small-business lending franchise. Treating all secured growth as one interchangeable engine would obscure the mix. Q2 presentation, page 9.
Asset quality: improvement, with qualifications
Gross NPAs fell from ₹2,377.56 crore a year earlier to ₹1,456.12 crore. The ratio declined from 2.32% to 1.02%. The absolute decline matters: improvement is more than the mathematical effect of a larger loan book. Standalone results, page 2.
Still, write-offs contribute to the clean-up. The presentation records approximately ₹809 crore of Q2 write-offs and ₹894 crore of fresh additions to NPAs. Removing a loan from the reported balance does not undo its economic loss. Falling problem-loan stocks should therefore be assessed alongside fresh stress, recoveries and provisions. Q2 presentation, page 10.
Judgement: A stronger capital cushion buys time and capacity. It cannot substitute for underwriting discipline when lending expands quickly.
Value the returns that capital can produce
Reported return on equity was 4.43%, against 4.44% a year earlier, even as return on assets improved from 0.48% to 0.92%. The fresh equity helps explain why a much bigger profit has yet to lift ROE. Q2 release, key ratios.
Management’s July ambition was to reach double-digit ROE over three to four years, potentially earlier if conditions improved. That was an aspiration, not a guaranteed timetable. Q1 call transcript.
A sensible valuation framework starts with book value per share, sustainable ROE and the return investors require for the risk. A premium to book needs credible future earnings on that book. A discount can persist when capital earns too little, even if solvency is comfortable. Neither a current share price nor a target price is assumed here.
The favourable case is that promoter-linked funding, lower financing costs and better operating efficiency compound into stronger per-share earnings as capital is deployed. The adverse case is that unusual funding flows and rapid balance-sheet growth look impressive while ordinary deposit gathering and through-cycle returns remain weak.
Four observations would change the assessment:
- Consistent EPS and ROE improvement after the share denominator has stabilised would strengthen the case.
- Broader recurring deposits and sustained average CASA growth would support funding quality.
- Renewed slippages or rising loss charges would weaken the clean-up thesis.
- Growth without an improving return on equity would suggest that capital is being used faster than shareholder value is being created.
Bottom line: RBL has received the capital and delivered a better operating quarter. The investment case now depends on converting that stronger platform into durable earnings per share and adequate returns on equity. The 170% headline is an opening observation, not the conclusion.
Disclosure: The author confirms that he, his associates and relatives have no holdings in RBL Bank and no compensation or dealings with the company.
Regulatory information
This page provides general information about Company Anatomy and the disclosure principles applied to its research. Every dated research report must also be read with its own disclosures, assumptions, risks and source notes.
Research Analyst information
| Name | Aditya Siddharth Mehta |
|---|---|
| Capacity | SEBI-registered Research Analyst — individual registration |
| SEBI registration number | INH000029768 |
| SEBI validity from | 20 August 2026 — Perpetual |
| BSE enlistment number | 7462 |
| Business name | Company Anatomy |
| Telephone | +91 7021135925 |
| Email and grievance contact | adi2001me@gmail.com |
| Correspondence address | Aditya Villa, Daksha Niwas, S.T. Road, Chembur, Mumbai, Maharashtra 400071 |
Business activities and service scope
Company Anatomy publishes independent equity research and educational material concerning Indian listed companies. Research may include business analysis, financial estimates, valuation work, risks and analyst judgement. The website does not provide portfolio management, trade execution, custody, banking, legal, tax or personalised financial-planning services.
Independent and completely free public research
All Company Anatomy research and reports are independent and completely free to read and download. There is no subscription charge, purchase condition or obligation to open a brokerage account or trade. Free public access is a core value of Company Anatomy. Research opinions are intended to reflect analysis and evidence rather than a reader’s transactions.
Merely reading or downloading publicly available research does not by itself create a personalised investment-advisory engagement or an agreement for a separately arranged service. It does not waive investor protections or remove applicable Research Analyst obligations. Whether a particular relationship constitutes a client relationship depends on the actual arrangements and applicable law, including direct or indirect economic benefits; it cannot be settled by calling a report “free”.
Reports are not an offer, invitation or solicitation to buy or sell any security or to enter into a transaction. Where a report contains a recommendation, rating or target price, it remains research subject to applicable requirements; it is not personalised investment advice. Do not use a report as the sole basis for an investment decision.
General nature of research
Research and recommendations are general and are not tailored to an individual reader’s objectives, financial situation, risk tolerance or needs. General website information is not a personalised investment recommendation or a solicitation of an offer to buy or sell a security. This distinction does not exclude the Research Analyst’s applicable regulatory duties. Investors should make an independent assessment and obtain professional advice appropriate to their circumstances.
Sources, estimates and changes
Information is obtained from sources believed to be reliable, with preference for company filings, exchange disclosures and other primary material. Accuracy, adequacy and completeness are not guaranteed. Information may be incomplete or condensed. Forecasts, valuations, target prices and scenarios are estimates rather than facts. Opinions and estimates are the Research Analyst’s judgement as of the stated date and may change without notice.
Ownership, financial interests and material conflicts
Each research report or public recommendation must state, as applicable, whether the Research Analyst, associates or relatives have a financial interest in the subject company; actual or beneficial ownership of one per cent or more of its securities at the end of the month immediately preceding publication; or another material conflict of interest. Aditya Siddharth Mehta has confirmed that there is no business conflict of interest as of 17 September 2026. This business-conflict declaration is not a declaration that the analyst, associates or relatives have no security holdings or issuer relationships. Because holdings and circumstances can change, this general page does not make a permanent “no conflict” representation. The dated report-specific disclosure governs.
Compensation and other relationships
Each research report must disclose applicable compensation received from the subject company during the preceding twelve months, including compensation for investment-banking, merchant-banking, brokerage or other products and services; compensation or benefits connected with the research; whether the subject company was a client during the applicable period; and participation in managing or co-managing a public offering. No blanket statement is made on this page because the disclosure must be current for the subject company and report date.
Other report-specific declarations
- Whether the Research Analyst serves as an officer, director or employee of the subject company.
- Whether the Research Analyst has engaged in market-making activity in the subject company’s securities.
- Relevant associates, business relationships and any fact that could affect independence or objectivity.
- The valuation method and material risks that may prevent achievement of a stated target price.
- Any material disciplinary history, regulatory action, litigation, inspection or investigation required to be disclosed.
If a required report-specific declaration is absent or unclear, do not rely on the recommendation until clarification is obtained from the Research Analyst.
Use of artificial intelligence
Company Anatomy uses artificial intelligence to improve readability and writing, assist valuation calculations and run simulations. The extent and material role of AI in a particular report should be read with that report’s methods and source notes. The Research Analyst remains responsible for the research, human review, accuracy controls, security, confidentiality, integrity and regulatory compliance, regardless of the extent of AI use. AI can produce incorrect text, calculations or assumptions. Readers should cross-check material figures against original filings and source documents, examine assumptions and periodically consult a SEBI-registered investment adviser about their own financial circumstances. These precautions do not transfer the analyst’s regulatory responsibilities to the reader.
Valuation, forecasts and simulation limitations
Valuation models and simulations are conditional analytical tools. Outputs depend on input quality, assumptions, correlations, distributions and model design; they can omit risks and produce materially different results when assumptions change. A simulated frequency is not an observed probability of future investment success. Model values and target prices are not guarantees, promises of returns or precise forecasts. Review the valuation date, horizon, scenarios, sensitivity analysis and downside risks. Historical or simulated performance does not establish future performance.
Market risk and performance
Investment in securities market are subject to market risks. Read all the related documents carefully before investing.
Past performance is not an indicator of future performance. Prices and returns may be volatile, and an investor may lose part or all of the capital invested. Registration granted by SEBI, enlistment with BSE and certification from NISM in no way guarantee performance of the intermediary or provide any assurance of returns to investors.
Distribution, report versions and corrections
Research is intended for lawful access and use. It is not directed to a person or jurisdiction where distribution or use would breach applicable law or require a registration that the Research Analyst does not hold. Free access is not a representation of authorisation outside India. When sharing a report link, retain its date, author, qualifications and disclosures; do not present extracts or simulations as guaranteed returns. A downloaded copy reflects its stated publication date. Check the original report page for subsequent revisions and contact the Research Analyst about a suspected error.
Website, third-party links and liability
The website and its content are provided for information on an “as is” and “as available” basis. Links to third-party websites are provided for convenience and do not constitute endorsement. To the extent permitted by applicable law, Company Anatomy is not responsible for decisions made solely in reliance on general website content or for loss arising from third-party content, interruptions or technical errors. Nothing on this page excludes duties or liability that cannot lawfully be excluded.
Grievances and dispute resolution
First raise a concern directly with Company Anatomy using adi2001me@gmail.com. If the response is unsatisfactory, use SEBI SCORES. Eligible unresolved disputes may be taken to SMART ODR in accordance with the applicable process. See the Grievance Redressal, Investor Charter and Investor Complaints pages.
Regulatory sources
- SEBI Master Circular for Research Analysts, 6 February 2026
- SEBI Investor Charter for Research Analysts, 2 June 2025
Last reviewed: 17 September 2026. This page should be updated when the applicable regulatory framework or the Research Analyst’s material circumstances change.