Research cutoff: 4 October 2026, approximately 17:24 UTC.
Nykaa’s latest update strengthens the case that its Fashion operation can grow. The more useful shareholder question is whether that growth will leave cash after the costs of maintaining the platform, financing stores and acquiring brands.
There is real progress. FY26 operating cash flow rose to ₹644.30 crore from ₹466.63 crore. A specified cash measure after all reported cash capex, lease principal, lease interest and borrowing interest increased to ₹197.97 crore from ₹87.35 crore. This is a substantial improvement, not merely an EBITDA story. It is neither distributable cash nor a definitive estimate of owner earnings. [1]
The central finding is conditional: Beauty is already funding a stronger group; Fashion has crossed a quarterly operating threshold; the next proof must come from cash conversion and returns on incremental capital, including acquisition obligations.
Start with the business, not its reported growth rate
Nykaa combines businesses with different economics. Beauty includes inventory-based omnichannel retail, owned brands and distribution. Fashion is predominantly a marketplace, alongside selected deeper brand-operating arrangements and owned brands. Beauty inventory can support availability and experience but commits working capital. A marketplace can expand assortment without owning every item, but still pays for discovery, fulfilment, returns and customer acquisition. Consolidated revenue is therefore an imperfect measure of underlying retail activity. [2] [4]
Nykaa defines GMV before returns and cancellations; NSV removes discounts, cancellations, returns and taxes. Neither substitutes for recognized revenue. In FY26 Fashion generated ₹4,954 crore GMV, ₹1,447 crore NSV and ₹832 crore revenue. Beauty produced ₹14,954 crore GMV, ₹8,504 crore NSV and ₹9,139 crore revenue. Their accounting and activity measures do not translate into revenue the same way. Group totals also include GCC and international operations. [2] [5]
The plausible advantage is customer attention, beauty expertise, brand relationships and distribution, rather than an online storefront alone. Continued Beauty growth at positive margins, physical distribution and brand participation support this interpretation. Its durability against marketing costs, rival promotions and brands’ own channels remains unmeasured. This is an analyst interpretation, not an independently measured market-share claim.
What the October update establishes
The 4 October Q2 FY27 communication provisionally expects consolidated revenue growth in the late twenties, Beauty revenue growth in the late twenties, Fashion revenue growth in the early forties and Fashion NSV growth in the late forties. It reports 14 net new stores, taking the network to 338 at 30 September, and like-for-like store sales growth in the early twenties, the best in six quarters. More of the festive season falls in Q3 this year. [5]
These are company estimates, not reported earnings, audited results or earnings guidance. They provide no Q2 EBITDA, cash flow or working-capital result. The growth ranges should not be converted to precise point estimates or assumed to imply a larger Fashion profit. The festive-calendar difference also matters.
Fashion has stopped being a large drag
FY26 Fashion EBITDA loss narrowed to ₹37 crore, or 2.6% of NSV, from ₹93 crore and 8.3% in FY25. Q4 FY26 reached approximately ₹1 crore EBITDA, a 0.3% margin. Q1 FY27 recorded ₹451 crore Fashion NSV and only ₹0.4 crore EBITDA, or 0.1%. Beauty generated ₹244 crore EBITDA on ₹2,371 crore NSV in that quarter. [2] [3]
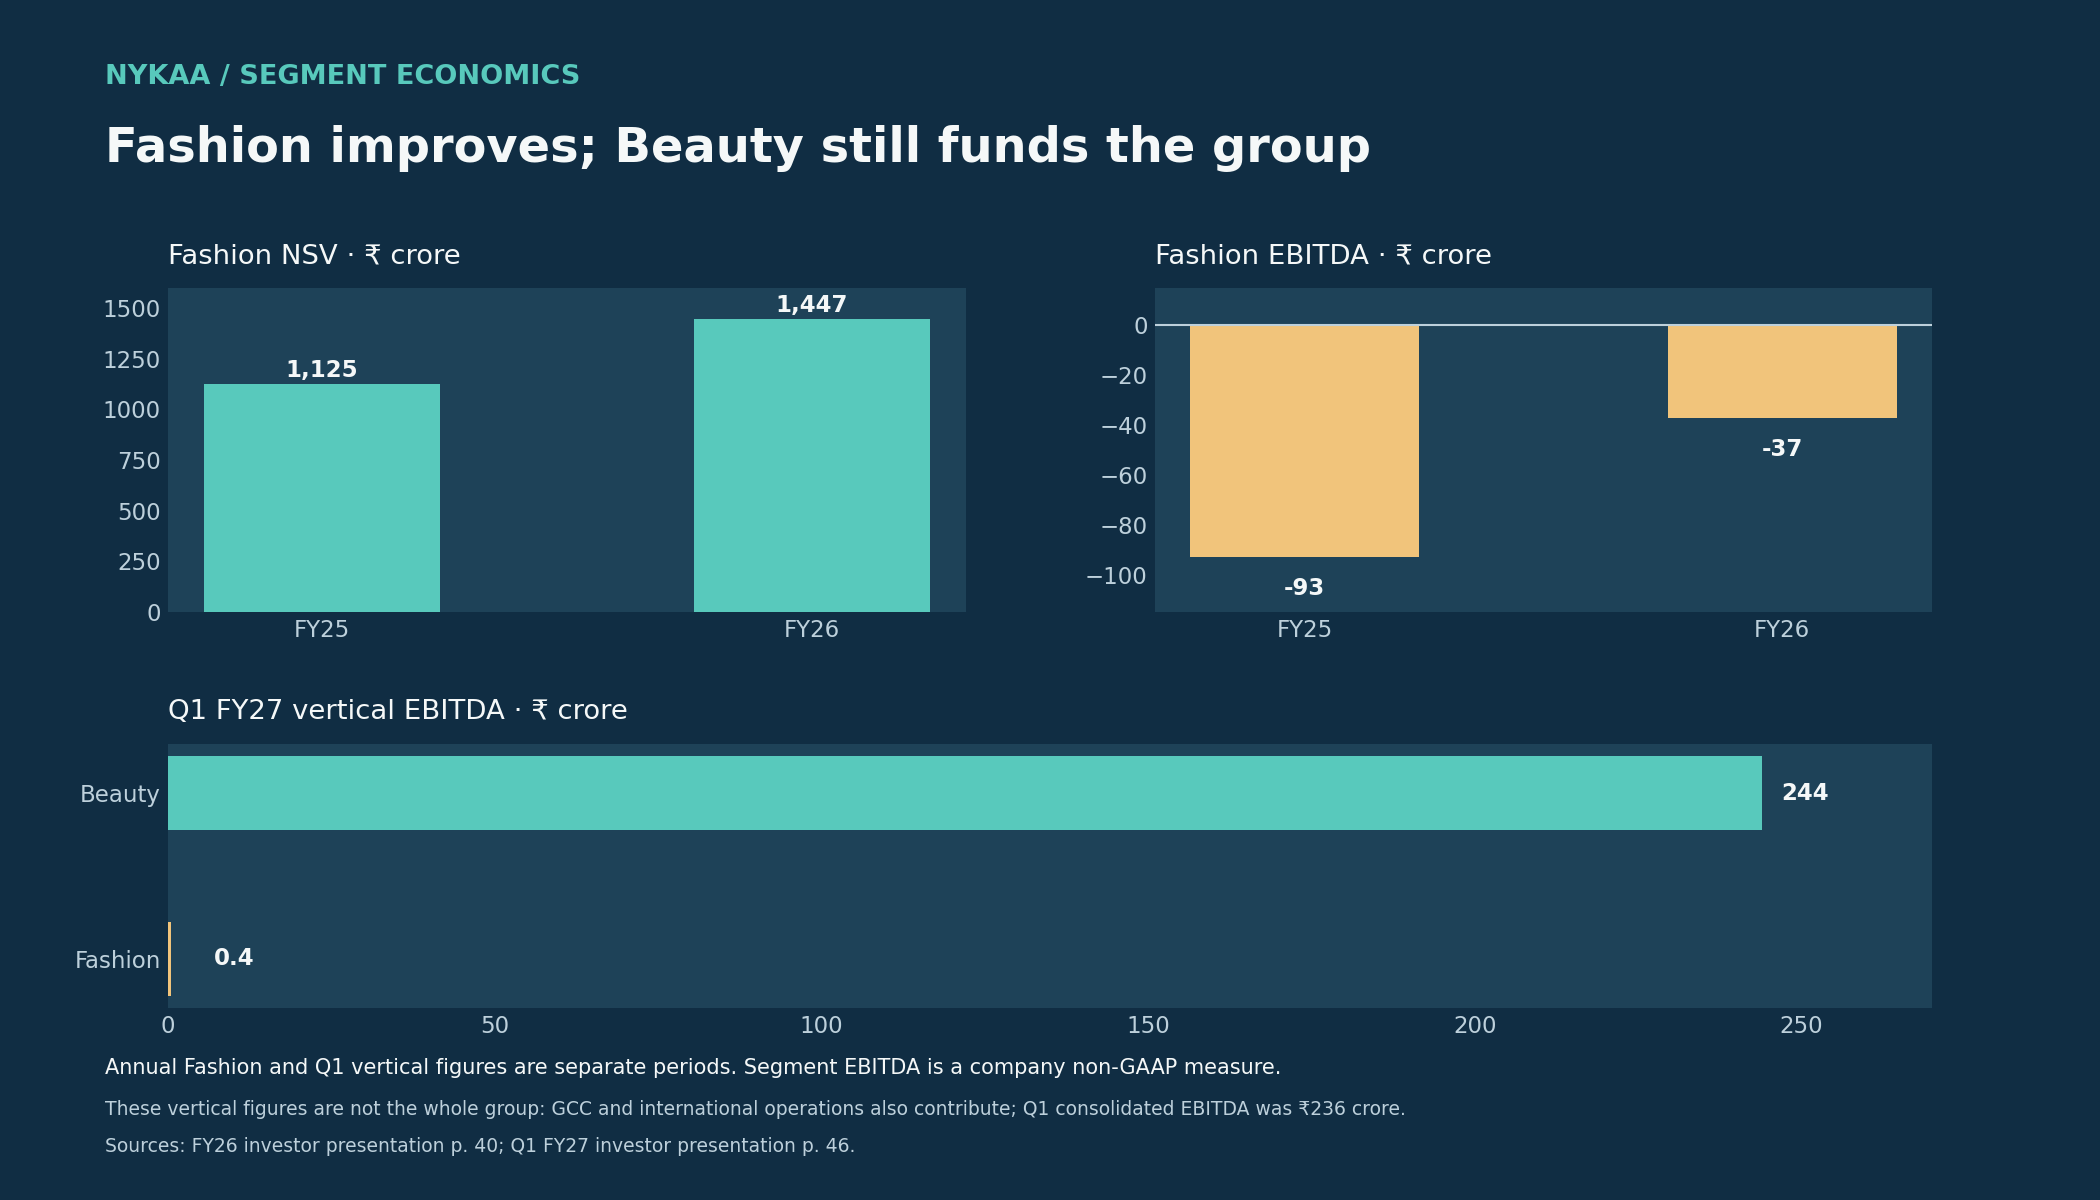
The audited segment note provides a harder test: FY26 Fashion lost ₹75.29 crore before exceptional items and tax, including ₹36.89 crore depreciation/amortisation and ₹2.30 crore allocated finance cost. It recorded ₹13.55 crore segment capex and ₹43.74 crore additions to right-of-use assets. This is not a segment cash-flow statement, and right-of-use additions are not current cash capex. It still shows why EBITDA break-even is not bottom-line break-even. [1]
Beauty remains the economic engine; Fashion’s current margin leaves little room for adverse execution. An illustrative one-percentage-point cost-ratio increase applied to Q1 Fashion NSV equals ₹4.51 crore, over eleven times its ₹0.4 crore EBITDA. This is a sensitivity, not a forecast or a claim that every expense scales with NSV.
Between Q1 FY26 and Q1 FY27, Fashion marketing and selling/distribution expense fell from 28.2% to 22.9% of NSV, and overhead from 14.2% to 11.3%. That outweighed a gross-margin decline from 47.3% to 44.7%. Retention and growth are useful if lower cost ratios persist after promotions and initial brand-partnership benefits. [3]
Nike illustrates the opportunity and the limit of public information. Management distinguishes an ordinary marketplace listing from operating Nike’s Indian D2C web and app channels end to end. It describes commission-like and service economics and inventory protection, but has not disclosed detailed contractual terms. The model may require less inventory; the contract’s profit, duration, termination, cash-settlement timing and customer-data economics remain unknown. [4]
An honest scorecard for earlier claims
In February 2025 management expressed comfort with Fashion break-even in the following financial year, while discussing customer acquisition and profitability. In May 2025, asked to reiterate FY26 break-even guidance, the Fashion head deferred detailed guidance to Investor Day and described earlier margin improvements as structural. [6] [7]
The precise outcome: Fashion achieved positive quarterly EBITDA in Q4 FY26 and remained marginally positive in Q1 FY27, while full FY26 remained EBITDA-loss-making. The earlier wording does not establish an unambiguous full-year profitability commitment. The exit-quarter milestone was achieved; full-year profitability was not.
The working-capital record is stronger. In May 2025 management reported 34 days, down from 42, and cautioned that future improvement was unlikely to be as steep. FY26 reported 28 days; the Q1 FY27 call said the below-30-day level had been sustained. These are management-defined operating-capital metrics, not all cash requirements. [7] [2] [4]
Follow audited cash through the accounts
The following bridge uses audited consolidated cash-flow classifications. Amounts are ₹ crore; FY25 comparatives come from the same FY26 report. [1]
| Cash bridge | FY25 | FY26 |
|---|---|---|
| Operating cash flow, after cash taxes | 466.63 | 644.30 |
| Cash purchases of property, equipment and intangibles, net of capital advances | (127.22) | (153.87) |
| Lease principal payments | (146.49) | (173.40) |
| Lease interest paid | (33.18) | (42.68) |
| Cash after capex and full lease payments | 159.74 | 274.35 |
| Interest paid on borrowings | (72.39) | (76.38) |
| Cash after those specified deductions | 87.35 | 197.97 |
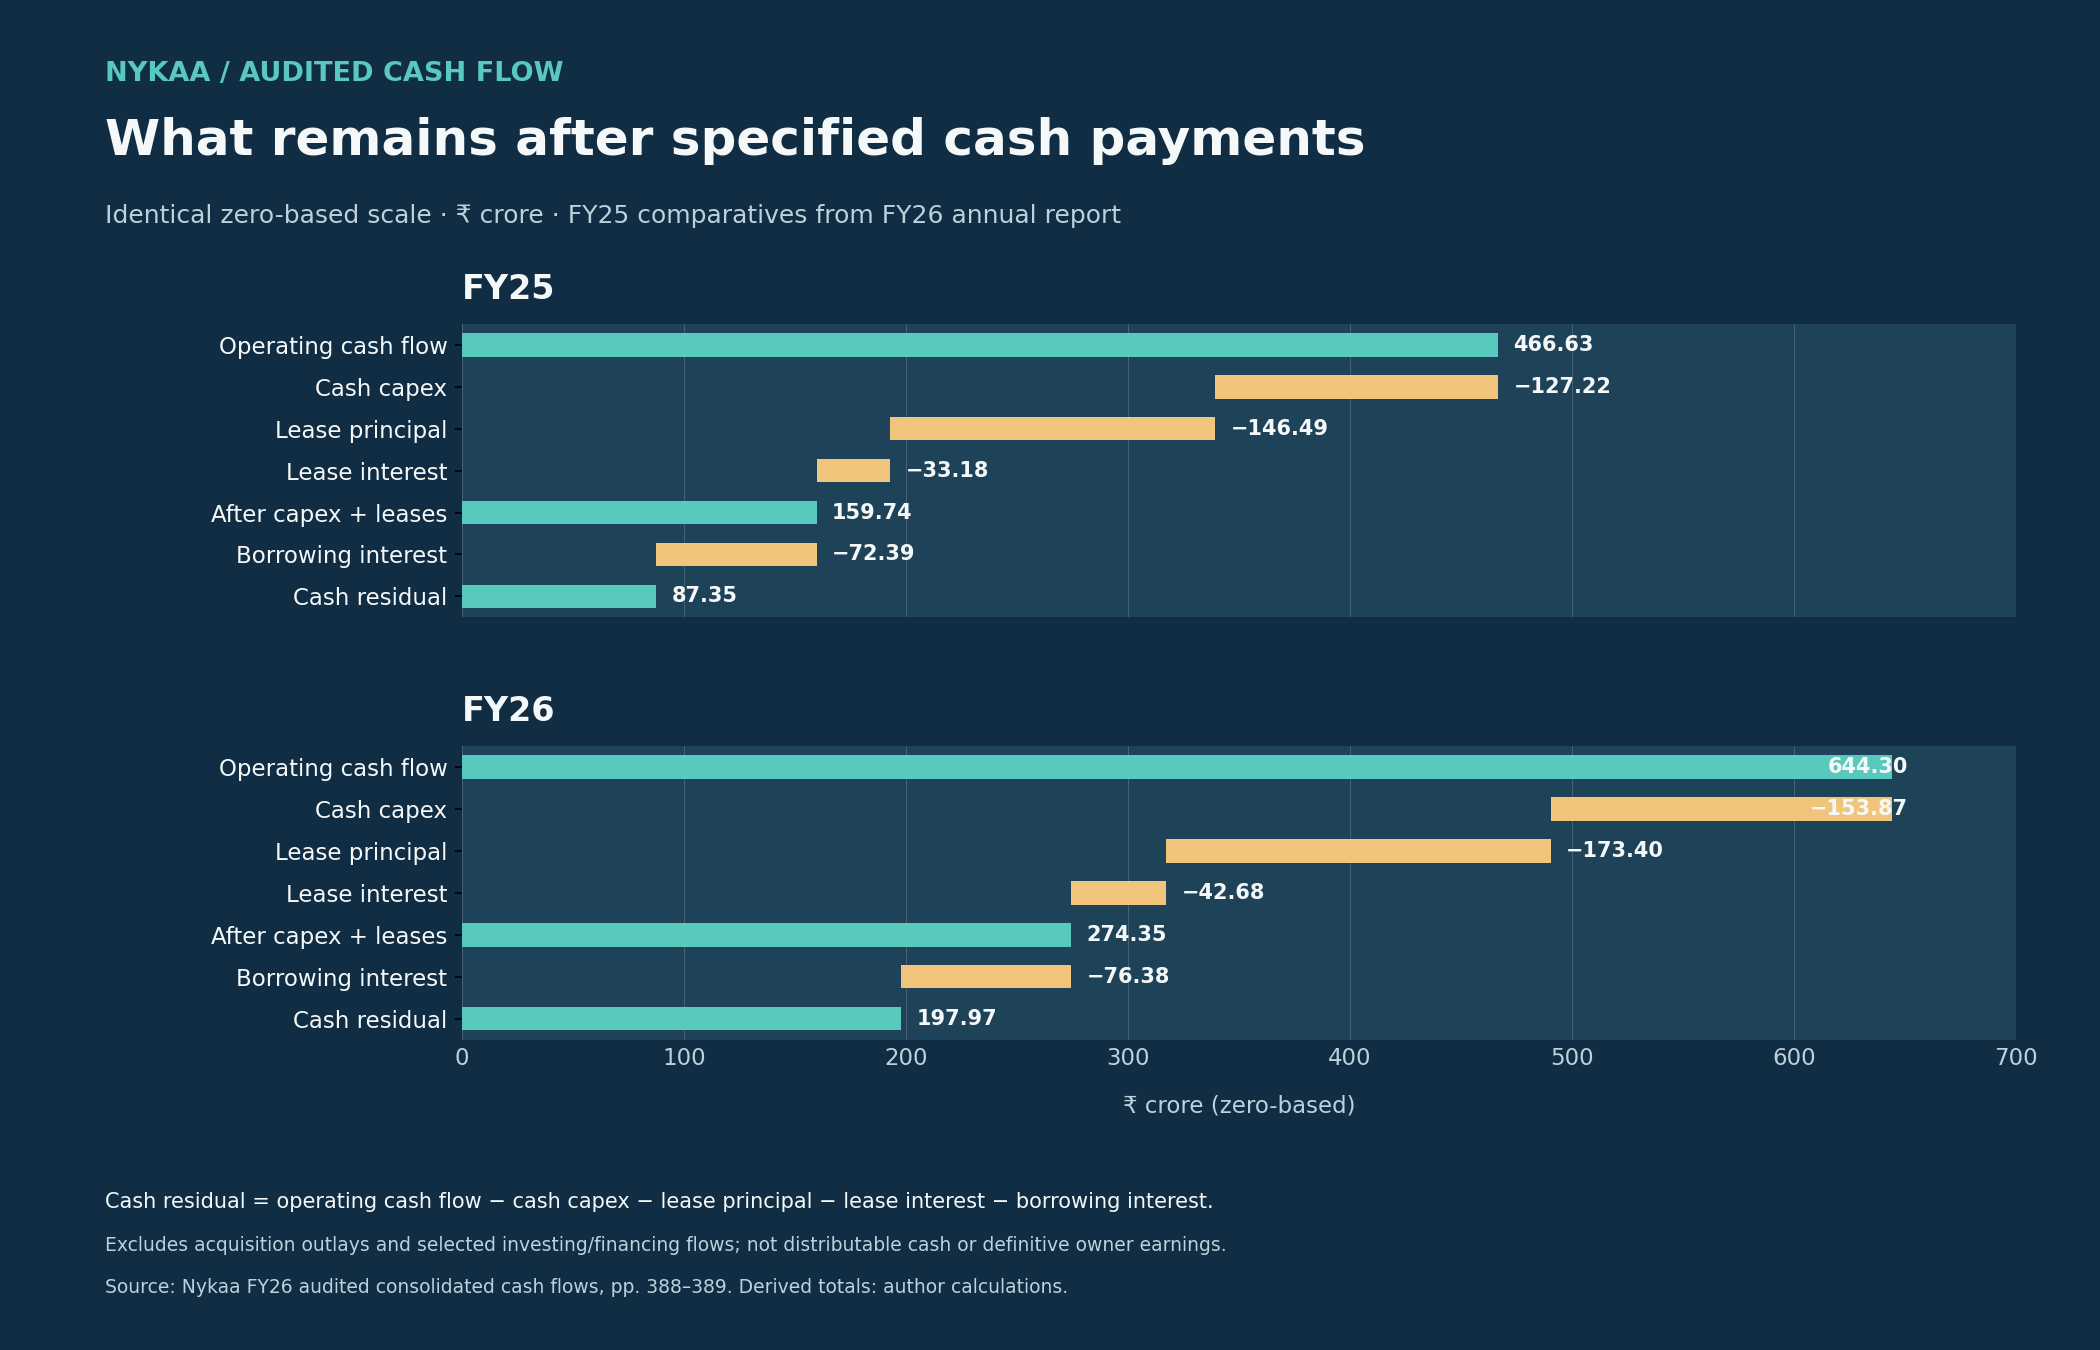
The FY26 presentation’s approximately ₹274 crore measure equals operating cash flow less cash capex and both lease components. Borrowing interest is another financing cash payment. Subtracting it produces ₹197.97 crore. Do not subtract aggregate finance expense again: the interest rows already include reported financing cash payments. Short-term lease and common-area costs recognized in operating expenses must not be subtracted twice. [1] [2]
The ₹752 crore reported EBITDA also needs definition discipline. Audited PBT ₹330.23 crore plus depreciation/amortisation ₹320.33 crore and finance costs ₹117.12 crore, less other income ₹32.77 crore, gives ₹734.91 crore. Adding the ₹17.40 crore exceptional item gives ₹752.31 crore, approximately the presentation’s ₹752 crore. The headline is before the exceptional item; this is a reconciliation, not an allegation about cash accounting. [1] [2]
All cash capex is deducted because maintenance and growth capex are not separated. The residual excludes acquisitions, investing-category bank/fixed-deposit movements and investment receipts. Operating cash flow may already include operating security-deposit movements. Share-based compensation is added back there but still costs owners through dilution. Subsidiary cash and non-controlling interests constrain parent distributions; taxes and year-end working capital may not represent a normalized year. This is a historical cash test, not owner earnings to the last rupee.
Working capital: definitions matter
FY26 operating profit before working-capital changes was ₹794.61 crore. Net working-capital movements consumed ₹15.14 crore, leaving ₹779.47 crore before cash taxes; taxes of ₹135.17 crore produced ₹644.30 crore operating cash flow. Inventory used ₹224.62 crore and receivables ₹47.03 crore. Trade payables supplied ₹97.98 crore and current financial liabilities ₹246.16 crore. Other operating movements account for the balance. [1]
The presentation’s ₹1,243.5 crore operating “trade payables” equals audited trade payables ₹732.50 crore plus accrued expenses ₹511.01 crore. FY25 comparatives were ₹634.83 crore plus ₹311.82 crore, or ₹946.65 crore. The presentation combines items for its operating-capital analysis; the balance sheet separates them. This reconciles the definitions rather than implying misstatement. [1] [2]
Watch settlement of those accruals as sales grow. FY26 cash conversion benefited from their increase. Assuming an immediate full unwind is too pessimistic; extrapolating the same funding benefit indefinitely is too optimistic. Lower reported working-capital days can coexist with new leases or acquisition payments outside that metric.
Stores and acquisitions create further claims
Lease liabilities rose from ₹359.23 crore to ₹490.60 crore in FY26 despite ₹216.08 crore cash lease payments; new lease additions were ₹348.77 crore. Stores may earn attractive returns, but investment is not captured solely by ₹153.87 crore cash capex. Lease additions are future obligations, not another current-year cash deduction in the bridge. [1]
Reported net debt was approximately ₹329 crore: ₹747.2 crore borrowings less ₹418.3 crore cash and bank balances including deposits. Lease liabilities and acquisition obligations were separate. The headline net-debt figure is not the complete list of claims on enterprise value, and not every deposit is necessarily distributable cash. [2]
The March 2026 current-liability note records ₹269.54 crore for a put option on Dot & Key’s remaining ownership, versus ₹135.88 crore non-current at March 2025. Value is linked to Dot & Key’s future performance. The equity note records ₹137.03 crore gross fair-value remeasurement, with other adjustments separately recorded. This future buyout cost is invisible in EBITDA; brand success can raise the price of buying remaining owners out. [1]
An author calculation reconciles the ₹269.54 crore closing balance: ₹135.88 crore opening liability plus ₹137.03 crore remeasurement less ₹3.37 crore consideration for a partial Dot & Key stake acquisition. The ₹3.37 crore appears in standalone investment Note 9(3), which reports 90.06% ownership after the transaction, leaving 9.94%. This is not a company-presented rollforward. Note 53’s narrative instead refers to ₹271.11 crore. The ₹1.57 crore difference from the closing balance remains unexplained in the reviewed material; it is not equated with the ₹3.37 crore purchase. [1]
FY25 included ₹267.92 crore for acquiring non-controlling interests in financing cash flows and ₹29.02 crore of investment/acquisition-related cash in investing. FY26 NCI acquisition cash was ₹3.51 crore. Lower acquisition spending improved cash retained after acquisitions, but did not cause the ₹87.35 crore to ₹197.97 crore change in our specified residual, which excludes acquisition outlays in both years. The presentation moves NCI acquisition payments into investing; the audited statement puts them in financing. [1] [2]
The August 2026 presentation announced a proposed 51% Aminu acquisition for ₹32 crore, with the other 49% to be acquired over subsequent years under transaction terms. It is later than the FY26 bridge and reinforces the distinction between cash generated and cash ultimately retained. Completion and final future consideration are not established here. [3] [4]
The strongest countercase
The favorable interpretation is that investments are beginning to work together. Beauty’s Q1 FY27 EBITDA margin was 10.3% of NSV. Fashion marketing and overhead ratios improved as NSV grew 54%. The FY26 post-capex, post-lease and post-borrowing-interest residual more than doubled while borrowings fell. Deducting all growth capex may understate mature earnings power. Acquired brands and stores can become productive assets. [1] [2] [3] [4]
The downside is that near-zero Fashion margin proves little about durable returns. Advertising, returns or fulfilment costs could erase it. Brand relationships might add volume without proportionate cash profit. Beauty could fund growth while leases, minority buyouts and acquisitions leave shareholders less than headline earnings suggest.
A rising ROCE is useful with its definition attached. The presentation defines capital employed with net worth and net debt, and annualizes Q1 FY27’s 26.8% figure. A denominator that does not present leases and acquisition claims in the same capital base is not a complete return on every economic commitment. [2] [4]
What would change the assessment
The case strengthens with several quarters of positive Fashion contribution and EBITDA after normal marketing, followed by cash after leases and capex; stable operating-capital ratios without continually rising unpaid costs; and brand/store investments that raise cash available per diluted share after buyouts.
It weakens with renewed Fashion losses despite growth, reversed marketing efficiency, inventory or accrued-liability settlement absorbing operating cash, or acquisitions consuming most of the cash-conversion improvement. These are monitoring criteria, not company guidance.
Q2 FY27 limited-review results and half-year cash-flow/balance-sheet disclosures can test whether provisional sales reached operating profit and cash, and update March-only obligation balances. Nykaa’s economic progress is tangible; proving scalable Fashion economics and attractive shareholder returns remain separate tests. No fair-value estimate, target price or buy/sell conclusion is offered because a reliable dated market price has not been verified for this memo.
Primary sources
[2] Q4/FY26 Investor Presentation, 21 May 2026; pp. 7, 40–43, 48–50.
[3] Q1 FY27 Investor Presentation, 4 August 2026; pp. 9, 28, 41, 46.
[4] Q1 FY27 conference-call transcript, 4 August 2026; pp. 8–9, 13–14, 21–22.
[5] Provisional Q2 FY27 revenue update, 4 October 2026.
[6] Q3 FY25 conference-call transcript, 10 February 2025; pp. 18–19.
[7] Q4 FY25 conference-call transcript, 30 May 2025; pp. 13–14, 16–17, 20–21.
Presentations and calls report management’s statements, not independent confirmation of contract protections or projected outcomes. Audited cash numbers, provisional estimates, company segment measures and author calculations are distinguished above.
Methodology and disclosures
Read the Company Anatomy research methodology and full disclosures and disclaimers.
For FSN E-Commerce Ventures (Nykaa), the research analyst confirmed on 4 October 2026 that he holds no shares or derivatives, including through associates or relatives to his knowledge, and no 1% ownership as of 30 September 2026 to his knowledge. He also confirmed no compensation, business/client relationship, company role, offering involvement, market-making activity or other material conflict involving the company for himself or associates in the prior 12 months.
This is general research, not personalised advice or a solicitation to transact. Investing in securities carries risk. Historical performance and scenario calculations do not assure future results. Artificial intelligence assisted writing, calculations and chart production; outputs may contain errors, and material figures should be checked against original sources. The research analyst remains responsible for research and compliance.
Regulatory information
This page provides general information about Company Anatomy and the disclosure principles applied to its research. Every dated research report must also be read with its own disclosures, assumptions, risks and source notes.
Research Analyst information
| Name | Aditya Siddharth Mehta |
|---|---|
| Capacity | SEBI-registered Research Analyst — individual registration |
| SEBI registration number | INH000029768 |
| SEBI validity from | 20 August 2026 — Perpetual |
| BSE enlistment number | 7462 |
| Business name | Company Anatomy |
| Telephone | +91 7021135925 |
| Email and grievance contact | adi2001me@gmail.com |
| Correspondence address | Aditya Villa, Daksha Niwas, S.T. Road, Chembur, Mumbai, Maharashtra 400071 |
Business activities and service scope
Company Anatomy publishes independent equity research and educational material concerning Indian listed companies. Research may include business analysis, financial estimates, valuation work, risks and analyst judgement. The website does not provide portfolio management, trade execution, custody, banking, legal, tax or personalised financial-planning services.
Independent and completely free public research
All Company Anatomy research and reports are independent and completely free to read and download. There is no subscription charge, purchase condition or obligation to open a brokerage account or trade. Free public access is a core value of Company Anatomy. Research opinions are intended to reflect analysis and evidence rather than a reader’s transactions.
Merely reading or downloading publicly available research does not by itself create a personalised investment-advisory engagement or an agreement for a separately arranged service. It does not waive investor protections or remove applicable Research Analyst obligations. Whether a particular relationship constitutes a client relationship depends on the actual arrangements and applicable law, including direct or indirect economic benefits; it cannot be settled by calling a report “free”.
Reports are not an offer, invitation or solicitation to buy or sell any security or to enter into a transaction. Where a report contains a recommendation, rating or target price, it remains research subject to applicable requirements; it is not personalised investment advice. Do not use a report as the sole basis for an investment decision.
General nature of research
Research and recommendations are general and are not tailored to an individual reader’s objectives, financial situation, risk tolerance or needs. General website information is not a personalised investment recommendation or a solicitation of an offer to buy or sell a security. This distinction does not exclude the Research Analyst’s applicable regulatory duties. Investors should make an independent assessment and obtain professional advice appropriate to their circumstances.
Sources, estimates and changes
Information is obtained from sources believed to be reliable, with preference for company filings, exchange disclosures and other primary material. Accuracy, adequacy and completeness are not guaranteed. Information may be incomplete or condensed. Forecasts, valuations, target prices and scenarios are estimates rather than facts. Opinions and estimates are the Research Analyst’s judgement as of the stated date and may change without notice.
Ownership, financial interests and material conflicts
Each research report or public recommendation must state, as applicable, whether the Research Analyst, associates or relatives have a financial interest in the subject company; actual or beneficial ownership of one per cent or more of its securities at the end of the month immediately preceding publication; or another material conflict of interest. Aditya Siddharth Mehta has confirmed that there is no business conflict of interest as of 17 September 2026. This business-conflict declaration is not a declaration that the analyst, associates or relatives have no security holdings or issuer relationships. Because holdings and circumstances can change, this general page does not make a permanent “no conflict” representation. The dated report-specific disclosure governs.
Compensation and other relationships
Each research report must disclose applicable compensation received from the subject company during the preceding twelve months, including compensation for investment-banking, merchant-banking, brokerage or other products and services; compensation or benefits connected with the research; whether the subject company was a client during the applicable period; and participation in managing or co-managing a public offering. No blanket statement is made on this page because the disclosure must be current for the subject company and report date.
Other report-specific declarations
- Whether the Research Analyst serves as an officer, director or employee of the subject company.
- Whether the Research Analyst has engaged in market-making activity in the subject company’s securities.
- Relevant associates, business relationships and any fact that could affect independence or objectivity.
- The valuation method and material risks that may prevent achievement of a stated target price.
- Any material disciplinary history, regulatory action, litigation, inspection or investigation required to be disclosed.
If a required report-specific declaration is absent or unclear, do not rely on the recommendation until clarification is obtained from the Research Analyst.
Use of artificial intelligence
Company Anatomy uses artificial intelligence to improve readability and writing, assist valuation calculations and run simulations. The extent and material role of AI in a particular report should be read with that report’s methods and source notes. The Research Analyst remains responsible for the research, human review, accuracy controls, security, confidentiality, integrity and regulatory compliance, regardless of the extent of AI use. AI can produce incorrect text, calculations or assumptions. Readers should cross-check material figures against original filings and source documents, examine assumptions and periodically consult a SEBI-registered investment adviser about their own financial circumstances. These precautions do not transfer the analyst’s regulatory responsibilities to the reader.
Valuation, forecasts and simulation limitations
Valuation models and simulations are conditional analytical tools. Outputs depend on input quality, assumptions, correlations, distributions and model design; they can omit risks and produce materially different results when assumptions change. A simulated frequency is not an observed probability of future investment success. Model values and target prices are not guarantees, promises of returns or precise forecasts. Review the valuation date, horizon, scenarios, sensitivity analysis and downside risks. Historical or simulated performance does not establish future performance.
Market risk and performance
Investment in securities market are subject to market risks. Read all the related documents carefully before investing.
Past performance is not an indicator of future performance. Prices and returns may be volatile, and an investor may lose part or all of the capital invested. Registration granted by SEBI, enlistment with BSE and certification from NISM in no way guarantee performance of the intermediary or provide any assurance of returns to investors.
Distribution, report versions and corrections
Research is intended for lawful access and use. It is not directed to a person or jurisdiction where distribution or use would breach applicable law or require a registration that the Research Analyst does not hold. Free access is not a representation of authorisation outside India. When sharing a report link, retain its date, author, qualifications and disclosures; do not present extracts or simulations as guaranteed returns. A downloaded copy reflects its stated publication date. Check the original report page for subsequent revisions and contact the Research Analyst about a suspected error.
Website, third-party links and liability
The website and its content are provided for information on an “as is” and “as available” basis. Links to third-party websites are provided for convenience and do not constitute endorsement. To the extent permitted by applicable law, Company Anatomy is not responsible for decisions made solely in reliance on general website content or for loss arising from third-party content, interruptions or technical errors. Nothing on this page excludes duties or liability that cannot lawfully be excluded.
Grievances and dispute resolution
First raise a concern directly with Company Anatomy using adi2001me@gmail.com. If the response is unsatisfactory, use SEBI SCORES. Eligible unresolved disputes may be taken to SMART ODR in accordance with the applicable process. See the Grievance Redressal, Investor Charter and Investor Complaints pages.
Regulatory sources
- SEBI Master Circular for Research Analysts, 6 February 2026
- SEBI Investor Charter for Research Analysts, 2 June 2025
Last reviewed: 17 September 2026. This page should be updated when the applicable regulatory framework or the Research Analyst’s material circumstances change.